Stáhnout prezentaci
Prezentace se nahrává, počkejte prosím

1
ZPRACOVÁNÍ A ANALÝZA BIOSIGNÁLŮ
ELEKTROENCEFALOGRAM

2
ELEKTROENCEFALOGRAM ELEKTROENCEFALOGRAM (EEG) je (grafická) reprezentace časové závislosti rozdílu elektrických potenciálů, snímaných z elektrod umístěných zpravidla na povrchu hlavy (skalpu), výjimečně přímo z kůry mozkové (elektrokortikogram), které vznikají jako důsledek spontánní elektrické aktivity mozku.
 je (grafická) reprezentace časové závislosti rozdílu elektrických potenciálů, snímaných z elektrod umístěných zpravidla na povrchu hlavy (skalpu), výjimečně přímo z kůry mozkové (elektrokortikogram), které vznikají jako důsledek spontánní elektrické aktivity mozku.")
3
proč elektroencefalogram?
diagnostika centrální nervové soustavy řízení prostředí neuroprotetika interface mozek x počítač (Brain-Computer Interface – BCI)
")
4
ELEKTROENCEFALOGRAM ELEKTROENCEFALOGRAM (EEG) (mozkové vlny) umožňuje hodnotit různé formy poškození mozku, onemocnění epilepsií případně další poruchy centrální nervové soustavy. Podle legislativy v mnoha zemích se záznam EEG používá k definici mozkové smrti. První záznam EEG, získaný Hansem Bergerem v 1924.
 (mozkové vlny) umožňuje hodnotit různé formy poškození mozku, onemocnění epilepsií případně další poruchy centrální nervové soustavy. Podle legislativy v mnoha zemích se záznam EEG používá k definici mozkové smrti. První záznam EEG, získaný Hansem Bergerem v")
5
MOZEK ZÁKLADNÍ ČÍSLA 2 hemisféry – na nich 4 laloky – čelní (frontální), temenní (parietální), týlní (occipitální), spánkový (temporální)
, temenní (parietální), týlní (occipitální), spánkový (temporální)")
6
EEG – SVODOVÝ SYSTÉM dr.Jaspers od 1958
Systém 10/20 je založen na vztahu mezi pozicemi elektrod a pod nimi ležící mozkovou kůrou. Pozice jednotlivých elektrod jsou definovány podle poměru 10/20% mezi kořenem nosu a týlní jamkou a mezi ušními lalůčky. Identifikace elektrod je založena na označení písmenem F (frontální), Fp (frontopolární), T (temporální), C (centrální), P (parietální) a O (occipitální) a zpravidla číslem – sudá čísla (2, 4, 6, 8) označují pozice nad pravou hemisférou, lichá čísla (1, 3, 5, 7) nad levou hemisférou, (čím menší hodnota, tím blíže ke středu). Písmeno z označuje elektrody v centrální linii.
, Fp (frontopolární), T (temporální), C (centrální), P (parietální) a O (occipitální) a zpravidla číslem – sudá čísla (2, 4, 6, 8) označují pozice nad pravou hemisférou, lichá čísla (1, 3, 5, 7) nad levou hemisférou, (čím menší hodnota, tím blíže ke středu). Písmeno z označuje elektrody v centrální linii.")
7
EEG – SVODOVÝ SYSTÉM

8
FAKULTA BIOMEDICÍNSKÉHO INŽENÝRSTVÍ • ČVUT V PRAZE

9
REŽIMY SNÍMÁNÍ unipolární – větší vlny, větší dynamika; horší lokalizace než u bipolárního zapojení;

10
EEG VLASTNOSTI SIGNÁLU
aktivita rytmická monomorfní (dominantní frekvence) polymorfní (více frekvenčních složek) arytmická (sled vln) ojedinělé útvary lambda vlna - trvání ~ 100 ms, výskyt v okcipitální krajině; hrot - trvání do max. 80 ms, kromě tvaru se hodnotí i souvislosti; komplex hrot-vlna – vlna pomalá, trvání 200 – 500 ms komplex mnohačetných hrotů a pomalých vln
 polymorfní (více frekvenčních složek) arytmická (sled vln) ojedinělé útvary. lambda vlna - trvání ~ 100 ms, výskyt v okcipitální krajině; hrot - trvání do max. 80 ms, kromě tvaru se hodnotí i souvislosti; komplex hrot-vlna – vlna pomalá, trvání 200 – 500 ms. komplex mnohačetných hrotů a pomalých vln.")
11
HROT - VLNA

12
KOMPLEX HROT - VLNA

13
EEG VLASTNOSTI SIGNÁLU
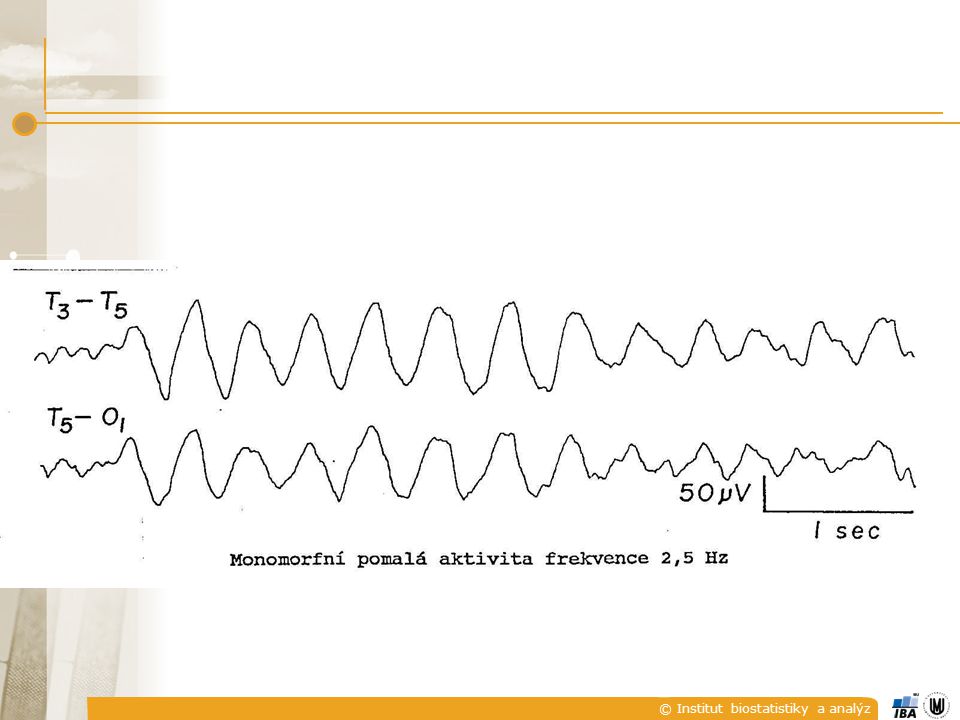
RYTMY delta (0-4 Hz) – u dospělého bdícího vždy patologie, u dětí kolem 4 měsíců jsou 4 Hz v normě; u dětí v prepubertě ojediněle osamocené vlny delta 75 – 100 μV v kombinaci s alfou výskyt ve spánku, velikost až 100 μV; čím je amplituda větší, resp. rozsah frekvencí užší, tím je patologie významnější
 – u dospělého bdícího vždy patologie, u dětí kolem 4 měsíců jsou 4 Hz v normě; u dětí v prepubertě ojediněle osamocené vlny delta 75 – 100 μV v kombinaci s alfou výskyt ve spánku, velikost až 100 μV; čím je amplituda větší, resp. rozsah frekvencí užší, tím je patologie významnější.")
14
EEG VLASTNOSTI SIGNÁLU
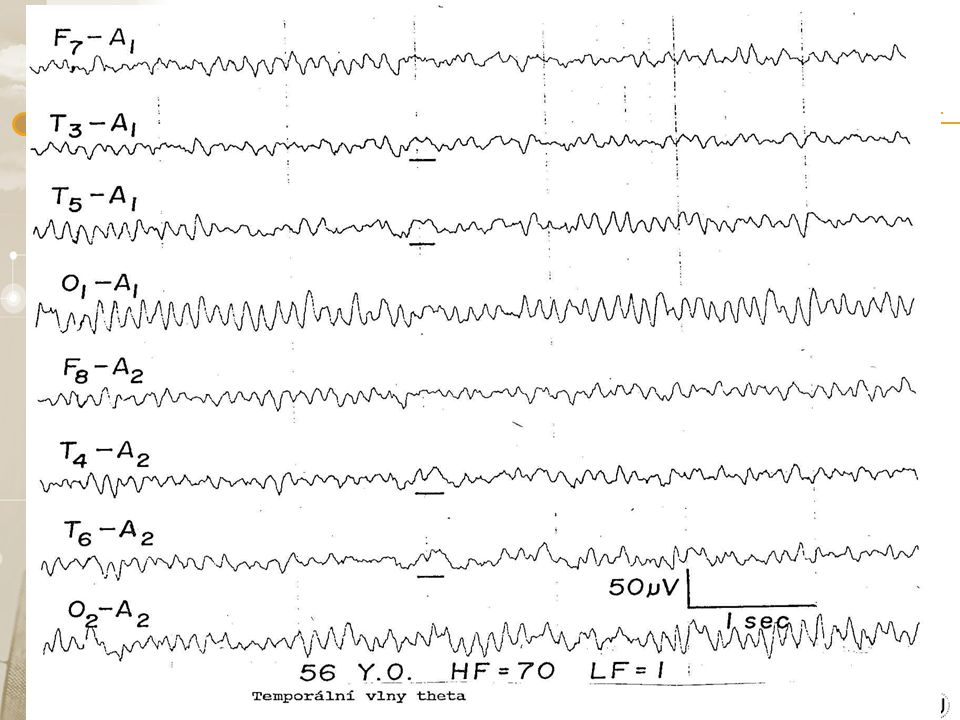
RYTMY theta (4-8 Hz) – napětí až do 150 μV; v oblastech centrální, temporální, parietální do 15 μV normál; patologie – je-li theta alespoň 2x vyšší než alfa nebo 30 μV, není-li alfa theta i delta stoupá u psychotestů s otevřenýma očima; zřídka je rytmický
 – napětí až do 150 μV; v oblastech centrální, temporální, parietální do 15 μV normál; patologie – je-li theta alespoň 2x vyšší než alfa nebo 30 μV, není-li alfa. theta i delta stoupá u psychotestů s otevřenýma očima; zřídka je rytmický.")
17
EEG VLASTNOSTI SIGNÁLU
RYTMY alfa (8-13 Hz) – v bdělém stavu max. nad zadními oblastmi mozkových hemisfér, nejlépe zavřené oči, před usnutím; tlumí se otevřením očí a duševní činností; od narození slepé osoby nemají alfa rytmus velikost signálu μV, trvání jednotlivých vln ms; u 85% zdravých osob ve věku 20 – 60 let je frekvence 9,5-10,5 Hz, vyšší kmitočet je normální, pokles pod 8 Hz je patologický; podle zastoupení v záznamu se rozlišuje – dominantní, subdominantní, smíšený a řídký alfa rytmus
 – v bdělém stavu max. nad zadními oblastmi mozkových hemisfér, nejlépe zavřené oči, před usnutím; tlumí se otevřením očí a duševní činností; od narození slepé osoby nemají alfa rytmus. velikost signálu μV, trvání jednotlivých vln ms; u 85% zdravých osob ve věku 20 – 60 let je frekvence 9,5-10,5 Hz, vyšší kmitočet je normální, pokles pod 8 Hz je patologický; podle zastoupení v záznamu se rozlišuje – dominantní, subdominantní, smíšený a řídký alfa rytmus.")
19
EEG VLASTNOSTI SIGNÁLU
RYTMY mí (mu) (7-11 Hz) – napětí pod 50 μV; charakteristický arkádový nebo hřebenový tvar – tvar písmene m či u, zřejmě nemá podstatný patologický význam, častěji se ale vyskytuje u psychicky narušených jedinců sigma (~14 Hz) – spánková vřeténka (III. spánkové stadium) ve frontální a frontocentrální oblasti; velikost 30 – 40 μV
 (7-11 Hz) – napětí pod 50 μV; charakteristický arkádový nebo hřebenový tvar – tvar písmene m či u, zřejmě nemá podstatný patologický význam, častěji se ale vyskytuje u psychicky narušených jedinců. sigma (~14 Hz) – spánková vřeténka (III. spánkové stadium) ve frontální a frontocentrální oblasti; velikost 30 – 40 μV.")
20
EEG VLASTNOSTI SIGNÁLU
RYTMY beta (13 – 30 Hz, někdy 18 – 32 Hz) – symetrický výskyt, dozadu ubývá, typické při soustředění na vnější podněty, při duševní činnosti a při afektech; velikost do 30 μV, trvání jednotlivých vln 40 – 50 ms gama (nad 30 Hz)
 – symetrický výskyt, dozadu ubývá, typické při soustředění na vnější podněty, při duševní činnosti a při afektech; velikost do 30 μV, trvání jednotlivých vln 40 – 50 ms. gama (nad 30 Hz)")
21
ZMĚNY V EEG SIGNÁLU PŘI ANESTÉZII

22
Bispectral index (BIS)
It was introduced by Aspect Medical Systems, Inc. in 1994[1] as a novel measure of the level of consciousness by algorithmic analysis of a patient's electroencephalogram during general anaesthesia. This is used in conjunction with other physiologic monitoring such as electromyography to establish the Guedel's classification in order to prevent surgical awareness. The efficacy of BIS index monitoring is not without controversy.[3] Some controlled studies have found that using the BIS reduced the incidence of memory but this was not confirmed in several very large multicenter studies on awareness. [4][5]

23
Bispectral index (BIS)
Explanation The BIS monitor provides a single dimensionless number, the BIS value, which ranges from 0 to 100. A BIS value of 0 equals EEG silence, near 100 is the expected value in a fully awake adult, and between 40 and 60 indicates a level for general anaesthesia recommended by the manufacturer. The BIS monitor thus gives the anaesthetist an indication of how "deep" under anaesthesia the patient is.BIS is one of several techniques which purport to monitor depth of anaesthesia. BIS monitors can replace or supplement Guedel's classification system for determining depth of anesthesia. Titrating anaesthetic agents to a specific bispectral index during general anaesthesia in adults (and children over 1 year old) allows the anaesthetist to adjust the amount of anaesthetic agent to the need of the patient, possibly resulting in faster recovery from anaesthesia (although often the reverse may occur, as the patient may be anaesthetised to a lower BIS level than is necessary for the surgery or procedure--this is called "treating the BIS," and may result in a deeper level of anaesthesia than required). The BIS monitor may reduce the incidence of intraoperative awareness in high risk procedures or patients [6] and may have an additional role in predicting recovery from severe brain injury although this is far from clear at present. The introduction of BIS to the intensive care environment allows physicians and nurses to titrate sedative drugs safely, and to monitor the patient (together with measurement of intracranial pressure) during therapeutic burst suppression. The monitoring of EEG in ICU patients has been employed in one form or other for more than two decades. BIS monitoring is also being used during transport of critically ill patients in ambulances, helicopters and other vehicles.
 allows the anaesthetist to adjust the amount of anaesthetic agent to the need of the patient, possibly resulting in faster recovery from anaesthesia (although often the reverse may occur, as the patient may be anaesthetised to a lower BIS level than is necessary for the surgery or procedure--this is called treating the BIS, and may result in a deeper level of anaesthesia than required). The BIS monitor may reduce the incidence of intraoperative awareness in high risk procedures or patients [6] and may have an additional role in predicting recovery from severe brain injury although this is far from clear at present. The introduction of BIS to the intensive care environment allows physicians and nurses to titrate sedative drugs safely, and to monitor the patient (together with measurement of intracranial pressure) during therapeutic burst suppression. The monitoring of EEG in ICU patients has been employed in one form or other for more than two decades. BIS monitoring is also being used during transport of critically ill patients in ambulances, helicopters and other vehicles.")
24
Bispectral index (BIS)
Calculation of BIS The essence of BIS is to take a complex signal (the EEG), analyse it, and process the result into a single number. Several other systems claim to be able to perform the same thing. This calculation is very computer-intensive. The recent availability of cheap, fast computer processors has enabled great advances in this field. When a subject is awake, the cerebral cortex is very active, and the EEG reflects vigorous activity. When asleep or under general anaesthesia, the pattern of activity changes. Overall, there is less activity (the "power" is less), there is a change from higher-frequency signals to lower-frequency signals (which can be shown by Fourier analysis), and there is a tendency for signal correlation from different parts of the cortex to become more random. The bispectral index of an electroencephalogram is a weighted sum of electroencephalographic subparameters including a time domain, a frequency domain, and higher order spectral information (Bispectral Analysis).The developers of the BIS monitor collected many (around 1000) EEG records from healthy adult volunteers at specific clinically important end points and hypnotic drug concentrations.They then fitted bispectral and power spectral variables in a multivariate statistical model to produce a BIS number. As with other types of EEG analysis, the calculation algorithm that the BIS monitor uses is proprietary. Therefore, although the principles of BIS and other monitors are well known, the exact method in each case is not. Anaesthesia depth in infants Some studies show a greater incidence of anaesthesia awareness in children, when compared to adults.The correlation between bispectral index in children over one year and state of consciousness has already been proven, although in younger patients the monitor is unreliable because of the differences between immature infant EEG patterns and the adult EEG patterns that the BIS algorithm utilises.
, analyse it, and process the result into a single number. Several other systems claim to be able to perform the same thing. This calculation is very computer-intensive. The recent availability of cheap, fast computer processors has enabled great advances in this field. When a subject is awake, the cerebral cortex is very active, and the EEG reflects vigorous activity. When asleep or under general anaesthesia, the pattern of activity changes. Overall, there is less activity (the power is less), there is a change from higher-frequency signals to lower-frequency signals (which can be shown by Fourier analysis), and there is a tendency for signal correlation from different parts of the cortex to become more random. The bispectral index of an electroencephalogram is a weighted sum of electroencephalographic subparameters including a time domain, a frequency domain, and higher order spectral information (Bispectral Analysis).The developers of the BIS monitor collected many (around 1000) EEG records from healthy adult volunteers at specific clinically important end points and hypnotic drug concentrations.They then fitted bispectral and power spectral variables in a multivariate statistical model to produce a BIS number. As with other types of EEG analysis, the calculation algorithm that the BIS monitor uses is proprietary. Therefore, although the principles of BIS and other monitors are well known, the exact method in each case is not. Anaesthesia depth in infants Some studies show a greater incidence of anaesthesia awareness in children, when compared to adults.The correlation between bispectral index in children over one year and state of consciousness has already been proven, although in younger patients the monitor is unreliable because of the differences between immature infant EEG patterns and the adult EEG patterns that the BIS algorithm utilises.")
25
Bispectral index (BIS)
BIS relevance The BIS is an electroencephalogram-derived multivariant scale that correlates with the metabolic ratio of glucose (Akire M., Anesthesiology 1998). From this metabolic activity the brain obtains its functionality, the ability to capture information from outside and inside the body and integrate that information into conscious perception, with the ability to remember it later. Both loss of consciousness and awakening from anaesthesia are correlated with this scale (Flashion R, et al. Anesthesiology 97). The bispectral index has not been proven to measure the level of consciousness, independently of the cause of reduced consciousness (whether this be drugs, metabolic disease, hypothermia, head trauma, hypovolemia, natural sleep and so on). Not all unconscious patients will have a low BIS value, although the general clinical state may be very different from one to the other, and the prognosis may also differ. The bispectral index is prone to artifacts. Its numbers cannot be relied upon in all situations, including brain death, circulatory arrest or hypothermia.[7] A monitor of the Autonomic Nervous System (such as the ANSiscope) may be more appropriate for purposely assessing the reaction to noxious stimuli during surgery. However, a monitor of the central nervous system may be more appropriate for monitoring consciousness. After the publication of the B-Aware Trial (P. Myles, K. Leslie et al. Lancet 2004) BIS is suggested as a parameter that allows the anaesthetist to reduce the risk of anaesthesia awareness during surgery for a 'high risk' group[8]. However, this result was not reproduced by a recently published randomized control trial, the "B-Unaware Trial".[9] In it, the use of BIS monitoring was not associated with a lower incidence of anesthesia awareness.
. From this metabolic activity the brain obtains its functionality, the ability to capture information from outside and inside the body and integrate that information into conscious perception, with the ability to remember it later. Both loss of consciousness and awakening from anaesthesia are correlated with this scale (Flashion R, et al. Anesthesiology 97). The bispectral index has not been proven to measure the level of consciousness, independently of the cause of reduced consciousness (whether this be drugs, metabolic disease, hypothermia, head trauma, hypovolemia, natural sleep and so on). Not all unconscious patients will have a low BIS value, although the general clinical state may be very different from one to the other, and the prognosis may also differ. The bispectral index is prone to artifacts. Its numbers cannot be relied upon in all situations, including brain death, circulatory arrest or hypothermia.[7] A monitor of the Autonomic Nervous System (such as the ANSiscope) may be more appropriate for purposely assessing the reaction to noxious stimuli during surgery. However, a monitor of the central nervous system may be more appropriate for monitoring consciousness. After the publication of the B-Aware Trial (P. Myles, K. Leslie et al. Lancet 2004) BIS is suggested as a parameter that allows the anaesthetist to reduce the risk of anaesthesia awareness during surgery for a high risk group[8]. However, this result was not reproduced by a recently published randomized control trial, the B-Unaware Trial .[9] In it, the use of BIS monitoring was not associated with a lower incidence of anesthesia awareness.")
27
EEG VLASTNOSTI RUŠENÍ
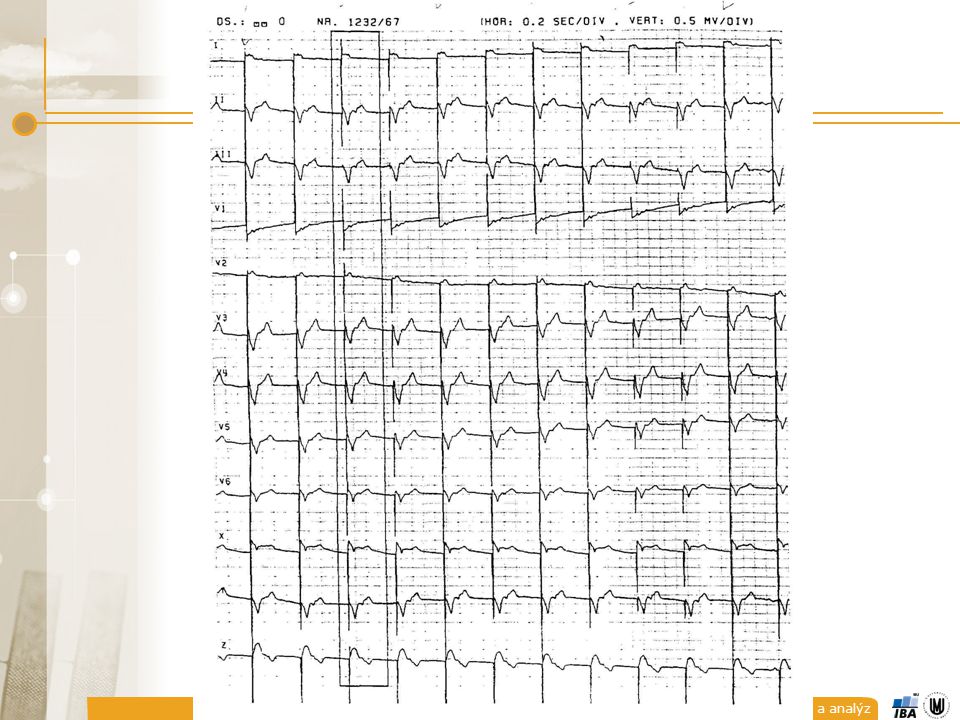
drift izolinie – vysoká vlny, trvání 2-3 s (0,5 Hz); artefakty z dýchacích pohybů – periody od 4 s; artefakty pulsové – zpravidla je-li elektroda nad artérií; artefakty EKG – hroty v období komplexů QRS – nízká amplituda, průšvih u kardiostimulátorů;
; artefakty z dýchacích pohybů – periody od 4 s; artefakty pulsové – zpravidla je-li elektroda nad artérií; artefakty EKG – hroty v období komplexů QRS – nízká amplituda, průšvih u kardiostimulátorů;")
30
DRIFT IZOLINIE POMALÉ POHYBY OČÍ

31
MRKÁNÍ

32
EKG ARTEFAKTY

33
EEG VLASTNOSTI RUŠENÍ
artefakty vyvolané pohyby očních bulbů – ve frontálních svodech, frekvence odpovídá delta až alfa vlnám (většinou pod 3 Hz); vf artefakty – myopotenciály velkých svalů (30-50 Hz)
; vf artefakty – myopotenciály velkých svalů (30-50 Hz)")
34
VZORKOVÁNÍ frekvenční obsah
spontánní EEG (0-70 Hz) evokované potenciály (potenciály mozkového kmene až do 3 kHz) spodní hranice vzorkovací frekvence fvz=125 Hz A/D převod nejčastěji 12 bitů, lze najít i hrubší kvantování, vyjímečně i 8 bitů; dynamický rozsah 500 μV 1 μV ~ 4 úrovně při kvatování na 12 bitů
 evokované potenciály (potenciály mozkového kmene až do 3 kHz) spodní hranice vzorkovací frekvence fvz=125 Hz. A/D převod nejčastěji 12 bitů, lze najít i hrubší kvantování, vyjímečně i 8 bitů; dynamický rozsah 500 μV 1 μV ~ 4 úrovně při kvatování na 12 bitů.")
35
ANALÝZA EEG 3 hlavní oblasti zájmu:
spontánní nezáchvatová aktivita (neparoxysmální, background) spontánní záchvatová aktivita (paroxysmální) (evokované potenciály)
 spontánní záchvatová aktivita (paroxysmální) (evokované potenciály)")
36
ANALÝZA EEG SPONTÁNNÍ NEZÁCHVATOVITÁ AKTIVITA
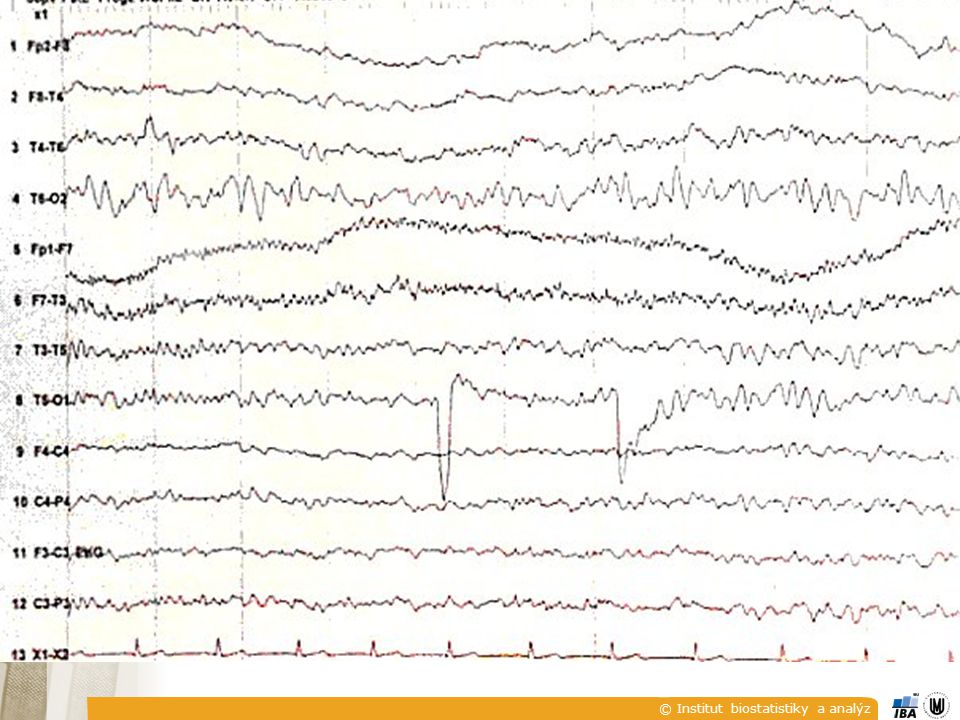
aktivita bez výrazných časových změn (normální spontánní aktivita při bdění a v klidu, alfa a beta rytmy, kontinuální pomalé rytmy, polymorfní pomalá aktivita, …); aktivita s pomalými změnami v čase (spánková aktivita, aktivita při změnách polohy, aktivita v komatu, aktivita při hyperventilaci, …); aktivita intermitentního typu (přerušovaná) (sigma aktivita, mí aktivita, přerušované pomalé rytmy)
; aktivita s pomalými změnami v čase. (spánková aktivita, aktivita při změnách polohy, aktivita v komatu, aktivita při hyperventilaci, …); aktivita intermitentního typu (přerušovaná) (sigma aktivita, mí aktivita, přerušované pomalé rytmy)")
37
ANALÝZA EEG SPONTÁNNÍ NEZÁCHVATOVITÁ AKTIVITA
grafoelementy hroty, ostré vlny, komplexy hrot/vlna rytmické formace hrot/vlna 3/s přechodné stavy ve spánku jednotlivé polyfázové vlnky paroxysmální pomalé vlny :

38
ANALÝZA EEG ZPŮSOB ZOBRAZENÍ
frekvenční oblast časová oblast mapování

39
ANALÝZA EEG POUŽÍVANÉ PROSTŘEDKY
frekvenční analýza stacionární analýza – testy stacionarity, FFT, neparametrické a parametrické metody nestacionární analýza – časový vývoj frekvenčního spektra, časově-frekvenční transformace, …. analýza v časové oblasti detekce grafoelementů - mimetické metody, korelační analýza, … mapování metody zpracování obrazů - korekce neostrostí, analýza vzájemných souvislostí, lokalizace zdrojů, modely, …

40
EEG VLASTNOSTI SIGNÁLU RYTMY
delta (0-4 Hz) theta (4-8 Hz) alfa (8-13 Hz) beta (13 – 30 Hz, někdy 18 – 32 Hz) gama (nad 30 Hz)
 theta (4-8 Hz) alfa (8-13 Hz) beta (13 – 30 Hz, někdy 18 – 32 Hz) gama (nad 30 Hz)")
Podobné prezentace


, spánek>")


, přes pásmo vln theta (4-7.>")


 Základní škola Jakuba Jana Ryby Rožmitál pod Třemšínem Efektivní výuka pro rozvoj potenciálu žáka projekt v rámci Operačního programu.>")


