Stáhnout prezentaci
Prezentace se nahrává, počkejte prosím

1
1 EKONOMICKÉ UKAZATELE Ing. Smutka

2
2 1. Ekonomický potenciál A) státy dle počtu obyvatel
 státy dle počtu obyvatel")
3
3 Státy podle počtu obyvatel

4
4

5
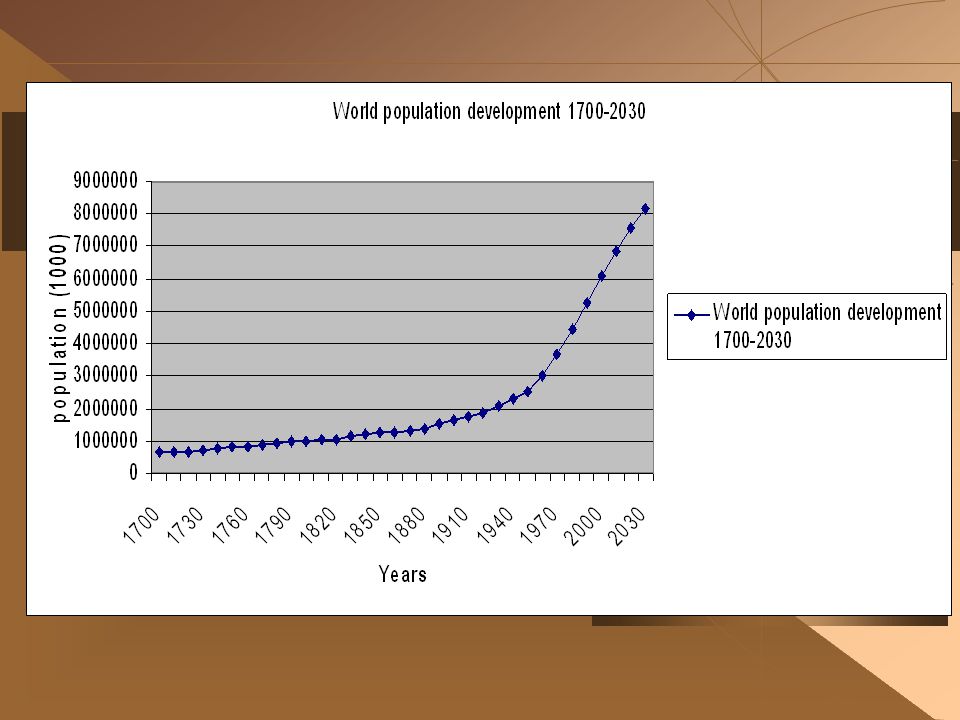
5 World historical and predicted populations (in millions) Region 1750 1800 1850 1900 1950 1999 2050 2150 World7919781,2621,6502,5215,9788,9099,746 Oceania222613304651 Northern America * 272682172307392398 Latin America and the Caribbean * 16243874167511809912 Europe163203276408547729628517 Asia5026358099471,4023,6345,2685,561 Africa1061071111332217671,7662,308
 Region World ,2621,6502,5215,9788,9099,746 Oceania Northern America * Latin America and the Caribbean * Europe Asia ,4023,6345,2685,561 Africa ,7662,308")
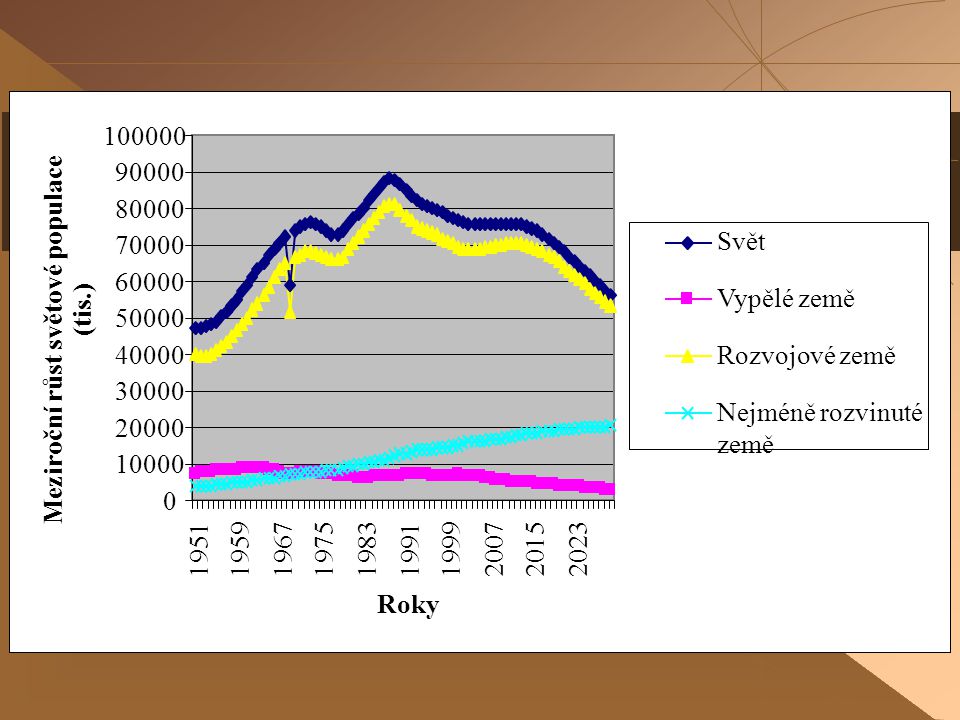
6
Vývoj světové populace

13
13 pořadí/státobyvatele 1997 (v mil.) % světa 1997 obyvatele 2004 (v mil.) % světa 2004 obyvatele 2006 % světa 2006 1. ČLR124421,3132120,7 1320 20 2.Indie96016,4108117112017 3.USA2724,72974,73004,6 4.Indonésie2033,52223,52253,5 5.Brazílie1632,81802,8 186 2,8 6.Pakistán1482,51572,51652,5 7. Bangladéš1442,51492,31472,3 8.Rusko1262,21422,21432,2 9.Japonsko1222,11282,0 128 2,0 10.Nigerie1182,01272,0 135 2,1 11.Mexiko941,6105 1,61081,7 14.SRN821,4831,3821,3 ČR10,20,210,20,16100,15 EU-15/253736,44857,64947,3 Svět5 849100 %6377100%6649100% Státy podle počtu obyvatel

14
14 Výhled OSN do 2025 Ekonomický potenciál

15
15

16
16 B) Plošně největší státy Ekonomický potenciál
 Plošně největší státy Ekonomický potenciál")
17
17 2. Ekonomická síla je vyjádřena soustavou ukazatelů, které vyjadřují podíl zkoumané země na světovém hospodářství (na celosvětové produkci)
.")
18
18 GDP (podíl na svět.ukazateli) Ekonomická síla Country Share in World GDP ($ constant 2000 prices) (%) 1979- 19811989-19911999-2001200320042006 World100 USA29,3729,3930,6830,6730,7531,11 Japan15,8517,1314,9514,4614,2613,91 Germany6,966,485,95,65,465,52 China1,362,374,345,145,425,70 United Kingdom4,984,734,554,534,484,54 France4,834,544,134,033,963,98 Italy4,133,843,43,263,173,15 Canada2,322,232,242,272,252,27 Brazil2,151,971,891,851,872,09 Spain1,821,81,781,791,771,92 2006 - HDP světa v cenách roku 2000 - USD 36 682 972 701 462,00
 Ekonomická síla Country Share in World GDP ($ constant 2000 prices) (%) World100 USA29,3729,3930,6830,6730,7531,11 Japan15,8517,1314,9514,4614,2613,91 Germany6,966,485,95,65,465,52 China1,362,374,345,145,425,70 United Kingdom4,984,734,554,534,484,54 France4,834,544,134,033,963,98 Italy4,133,843,43,263,173,15 Canada2,322,232,242,272,252,27 Brazil2,151,971,891,851,872,09 Spain1,821,81,781,791,771, HDP světa v cenách roku USD ,00")
19
19 GDP in current prices – IMF - 2006

20
20 3. Ekonomická úroveň měříme vyspělost dané země (tj. sledujeme spíše kvalitativní stránku zkoumaných jevů)
.")
21
21 HNP na obyvatele

22
22 GDP/capita

23
23 High income Upper-middle income Lower-middle income Low income

24
24 HDP/obyv., USD (FAO) Ekonomická úroveň Per Capita GDP ($ constant 2000 prices) 1979-19811989-19911999-200120032004 World39734531518953525505 Luxembourg1936530735440234555846987 Norway2163327445373103850539457 Japan2390933078370733819839184 USA2236127400339153517536352 Switzerland2835431964340433461835231 Iceland2160125318295963084532226 Denmark2090024467296123039331059 Ireland973413152245662820029264 Sweden1895222835267582825029235 United Kingdom1574319795243122568126399 Finland1528419559228672424925107 Canada1668119168229602431524835 Austria1563119381232992413924658 Singapore894214461219822222323746 Netherlands1565118518231482307723288 Belgium1509318420220432267123279
 Ekonomická úroveň Per Capita GDP ($ constant 2000 prices) World Luxembourg Norway Japan USA Switzerland Iceland Denmark Ireland Sweden United Kingdom Finland Canada Austria Singapore Netherlands Belgium")
25
25 GDP per capita, constant prices, US$ (UN estimates) Country or Area Name20002001200220032004200520062007 Luxembourg 46 57347 09648 25448 26349 37850 68652 70454 292 Norway 37 07237 59437 95538 14639 42640 18741 15442 311 Japan 36 60136 59536 62337 07938 04138 71839 52840 325 United States 34 36434 27834 48835 01636 04036 85237 71938 144 Switzerland 34 32834 57334 58734 45235 17535 79136 69837 524 Iceland 30 67531 56731 24331 80733 92236 02636 64436 805 Denmark 29 98030 07730 10930 12430 66831 51132 72433 310 Sweden 27 26127 48027 92728 28229 32730 06731 29932 438 Ireland 25 29826 32527 41828 06828 75429 84331 16532 273 United Kingdom 24 59225 08325 51126 10126 86327 29727 96628 647 Netherlands 24 31324 65024 54024 49724 85625 12325 77026 396 Austria 23 94224 10124 25224 45124 98325 43626 21226 940 Finland 23 29023 84024 16224 52025 30825 98027 33228 077 Canada 23 28023 46323 90824 09424 63825 11825 56125 895 Singapore 23 07922 08922 64123 03224 75026 06627 77129 105 Germany 23 07623 33823 31423 24923 52223 72224 35524 911 Belgium 22 50922 62722 91423 09023 72523 93524 51525 015 France 21 77622 09422 23422 39322 80722 99823 39323 752
 Country or Area Name Luxembourg Norway Japan United States Switzerland Iceland Denmark Sweden Ireland United Kingdom Netherlands Austria Finland Canada Singapore Germany Belgium France")
26
26 4. Dynamika růstu vyjadřuje se zpravidla vývojovými trendy, indexy tempo růstu HNP tempo růstu HDP tempo růstu průmyslové produkce, zemědělské produkce, jednotlivých výrobků či zemědělských komodit

27
27 GDP per capita, annual growth rate, 2000 US$ (UN DPAD/Link estimates) Country or Area Name2001200220032004200520062007 Luxembourg1.12.50.02.32.64.03.0 Norway1.41.00.53.41.92.42.8 Japan0.00.11.22.61.82.12.0 United States-0.30.61.52.92.32.41.1 Switzerland0.70.0-0.42.11.82.52.3 Iceland2.91.86.66.21.70.4 Denmark0.30.10.01.82.73.91.8 Sweden0.81.61.33.72.54.13.6 Ireland4.14.22.4 3.84.43.6 United Kingdom2.01.72.32.91.62.52.4 Netherlands1.4-0.4-0.21.51.12.62.4 Austria0.70.60.82.21.83.02.8 Finland2.41.41.53.22.75.22.7 Canada0.81.90.82.31.91.81.3 Singapore-4.32.51.77.55.36.54.8 Germany1.1-0.1-0.31.20.92.72.3 Belgium0.51.30.82.80.92.42.0 France1.50.60.71.80.81.71.5
 Country or Area Name Luxembourg Norway Japan United States Switzerland Iceland Denmark Sweden Ireland United Kingdom Netherlands Austria Finland Canada Singapore Germany Belgium France")
28
28 GDP growth rate, US$ (UN DPAD/Link estimates) Country or Area Name 2001200220032004200520062007 Azerbaijan9.910.611.210.226.434.529.0 Angola3.014.33.311.220.615.025.5 Sudan6.26.45.05.28.012.010.5 China8.39.110.010.110.210.710.1 Turkmenistan4.30.33.34.59.69.010.0 Armenia9.615.113.910.013.913.49.5 Kazakhstan13.59.89.39.69.510.69.5 Equatorial Guinea78.220.913.632.86.09.0 Latvia8.06.47.28.510.312.09.0 India5.04.07.18.5 9.08.4 Estonia6.57.26.77.810.511.48.3 Viet Nam6.97.17.37.88.48.28.3 Cuba3.01.52.94.28.510.08.0 Slovakia3.84.64.55.56.18.38.0 Liberia22.031.8-34.02.65.37.77.8 Argentina-4.4-10.98.79.09.28.57.5 Belarus4.75.07.011.49.29.97.5 Iraq4.0-5.7-44.346.53.78.07.5 Qatar6.37.33.39.36.17.07.4
 Country or Area Name Azerbaijan Angola Sudan China Turkmenistan Armenia Kazakhstan Equatorial Guinea Latvia India Estonia Viet Nam Cuba Slovakia Liberia Argentina Belarus Iraq Qatar")
29
29 GDP growth rate, US$ (UN DPAD/Link estimates) Country or Area Name2001200220032004200520062007 Somalia242.5-0.24.21.2 Chad11.88.515.533.28.61.30 Zimbabwe-2.542-4.348-7.4-3.62-4.06-1.930.56 Iceland3.904-0.0892.7457.6167.1522.6051.3 Gabon2.0380.0462.4191.3562.8792.21.5 Guinea3.84.21.22.73.22.21.5 Portugal2.0160.763-1.12-2.939-3.0521.31.6 Italy1.7960.3420.0371.065-0.0361.941.78 France1.861.0451.1422.2711.2342.11.9 Denmark0.7050.4660.3842.133.064.152.07 United States0.7511.5992.513.9063.2243.3182.074 Eritrea9.2310.6593.0031.12.12 Japan0.1840.2621.4142.7441.9072.22.1 Belgium0.7941.5090.9892.9571.072.62.2 Canada1.7842.9441.8233.2992.9362.72.2 Germany1.235-0.002-0.191.2520.9042.72.3 Switzerland1.0410.306-0.1692.2931.9292.72.4 New Zealand3.4764.6333.5965.02121.52.5 Nepal2.6821.23.543.312.3742.1432.586 Brunei Darussalam3.0472.8263.8111.7260.43.82.6 Hungary4.0914.344.1194.8754.2463.92.6 Cote d'Ivoire0.101-1.63-1.6611.8 2.42.7 United Kingdom2.3522.0592.6663.2631.9352.762.73 Netherlands1.9260.0760.3361.9531.5332.82
 Country or Area Name Somalia Chad Zimbabwe Iceland Gabon Guinea Portugal Italy France Denmark United States Eritrea Japan Belgium Canada Germany Switzerland New Zealand Nepal Brunei Darussalam Hungary Cote d Ivoire United Kingdom Netherlands")
30
ROZDÍLY MEZI STÁTY 30

31
31 WORLD LOW INCOMEMiddle IncomeHigh IncomeEUROLDCs 2008 Population, total (millions) 6,692.03972.844,650.671,068.53325.95815.16 Population growth (annual %) 1.22.11.10.70.52.3 Surface area (sq. km) (thousands) 134,095.419,310.579,484.935,300.12,585.220,803.1 GNI, (current US$) (billions) 57,637.51509.6215,159.6142,041.4012,653.57477.1 GNI per capita, (current US$) 8,6135243,26039,34538,821585 GNI, PPP (current international $) (billions) 69,308.961,368.7628,619.5139,686.3110,830.481,090.33 GNI per capita, PPP (current international $) 10,3571,4076,15437,14133,2281,338 Economy GDP (current US$) (billions) 60,587.02568.516,826.8743,189.9413,565.48551.39 GDP growth (annual %) 26.46.20.80.77.3 Inflation, GDP deflator (annual %) 8.19.69.732.99.6 Agriculture, value added (% of GDP).. 10.. Industry, value added (% of GDP).. 37.. Services, etc., value added (% of GDP).. 53.. Exports of goods and services (% of GDP).. 30.. 25 Imports of goods and services (% of GDP).. 29.. 33 Gross capital formation (% of GDP).. 30.. States and markets Time required to start a business (days) 384743201651 Military expenditure (% of GDP) 2.41.722.61.61.2 Mobile cellular subscriptions (per 100 people) 60295510612221 Internet users (per 100 people).. 67.161.6.. Global links Merchandise trade (% of GDP) 52.875.455.751.367.964.4 Workers' remittances and compensation of employees, received (current US$) (millions) 433,08730,757296,835105,49568,68321,253 Source: World Development Indicators database, September 2009
 (thousands) 134, , , ,300.12, ,803.1 GNI, (current US$) (billions) 57, , , , GNI per capita, (current US$) 8, ,26039,34538, GNI, PPP (current international $) (billions) 69, , , , , , GNI per capita, PPP (current international $) 10,3571,4076,15437,14133,2281,338 Economy GDP (current US$) (billions) 60, , , , GDP growth (annual %) Inflation, GDP deflator (annual %) Agriculture, value added (% of GDP) Industry, value added (% of GDP) Services, etc., value added (% of GDP) Exports of goods and services (% of GDP) Imports of goods and services (% of GDP) Gross capital formation (% of GDP) States and markets Time required to start a business (days) Military expenditure (% of GDP) Mobile cellular subscriptions (per 100 people) Internet users (per 100 people) Global links Merchandise trade (% of GDP) Workers remittances and compensation of employees, received (current US$) (millions) 433,08730,757296,835105,49568,68321,253 Source: World Development Indicators database, September")
32
32 EAST ASIA and PACIFIKSouth Asia Sub- saharská afrika Latin America and Caribbean EUROPE and CENTRAL ASIA Middle East and North AfricaUSAJAPAN 2008 Population, total (millions)1,931.181,542.95817.96565.29441.35324.79304.06127.7 Population growth (annual %)0.81.52.51.10.31.80.9-0.1 Surface area (sq. km) (thousands)16,299.35,139.524,241.920,421.023,915.88,777.99,632.0377.9 GNI, (current US$) (billions)5,080.461,521.58885.323,832.953,273.971,052.9114,466.114,879.17 GNI per capita, (current US$)2,6319861,0826,7807,4183,24247,58038,210 GNI, PPP (international $) (billions)10,425.914,217.641,628.345,827.405,393.17..14,282.674,497.72 GNI per capita, PPP (international $)5,3992,7331,99110,30912,220..46,97035,220 Economy GDP (current US$) (billions)5,658.321,531.50987.124,247.083,860.601,117.2014,204.324,909.27 GDP growth (annual %)86.954.45.55.81.1-0.7 Inflation, GDP deflator (annual %)7.9810.87.711.414.62.2 Agriculture, value added (% of GDP)1218146412.. Industry, value added (% of GDP)482932 2541.. Services, etc., value added (% of GDP)415354627148.. Exports of goods and services (% of GDP)352237233441.. Imports of goods and services (% of GDP)293040243438.. Gross capital formation (% of GDP)393623 2428.. States and markets Time required to start a business (days)443346702425623 Military expenditure (% of GDP)1.82.411.32.7 4.30.9 Mobile cellular subscriptions (per 100 c)52333280110578986 Internet users (per 100 people)23.3..4.5.. 24.272.4.. Global links Merchandise trade (% of GDP)68.439.664.341.658.259.524.431.5 Workers' remittances and compensation of employees, (current US$) (millions)78,13573,67619,79564,45457,10034,4323,0491,929 Source: World Development Indicators database, September 2009
 (thousands)16,299.35, , , ,915.88,777.99, GNI, (current US$) (billions)5, , , , , , , GNI per capita, (current US$)2, ,0826,7807,4183,24247,58038,210 GNI, PPP (international $) (billions)10, , , , , , , GNI per capita, PPP (international $)5,3992,7331,99110,30912, ,97035,220 Economy GDP (current US$) (billions)5, , , , , , , GDP growth (annual %) Inflation, GDP deflator (annual %) Agriculture, value added (% of GDP) Industry, value added (% of GDP) Services, etc., value added (% of GDP) Exports of goods and services (% of GDP) Imports of goods and services (% of GDP) Gross capital formation (% of GDP) States and markets Time required to start a business (days) Military expenditure (% of GDP) Mobile cellular subscriptions (per 100 c) Internet users (per 100 people) Global links Merchandise trade (% of GDP) Workers remittances and compensation of employees, (current US$) (millions)78,13573,67619,79564,45457,10034,4323,0491,929 Source: World Development Indicators database, September")
Podobné prezentace


 5. třída>")


 skupina: kontrolní pacienti průměr 41,08 51,67 sm.odch.>")


