Stáhnout prezentaci
Prezentace se nahrává, počkejte prosím

1
Anesteziologický přístroj, monitorace
L.Dadák ARK FNUSA & LF MU

2
5 úkolů O2

3
Plyny – značení ISO O2 - bílý
frakční destilace stlačeného = kapalného vzuchu. (N2 vře dříve než O2) N20 - modrý tlak 5 MPa Vzduch bílo/černý CO2 - šedý plyn hladina
 N20 - modrý. tlak 5 MPa. Vzduch bílo/černý. CO2 - šedý. plyn. hladina.")
4
Anesteziologický přístroj
umožňuje ventilovat definovanou směsí plynů bezpečnostními prvky brání podání hypoxické směsi části: 1.High pressure system 2.Low pressure system - směs plynů, inhalační anestetikum 3.Breathing circuit - vdech, výdech část 4.Ventilation systems (manual and mechanical) 5.Scavenging system - odtah anest.plynů
 5.Scavenging system - odtah anest.plynů.")
5
Části anest. přístroje 1 2 3 4 5

6
Vysokotlaká část Zdroj stlačeného plynu tlakové láhve
centrální rozvod plynů alarm nízkého tlaku O2 bezpečnostní chlopeň pO2 > pN2O redukční ventil manometr

7
Nízkotlaká část průtokoměry = flowmetr O2, AIR, N2O odpařovač bypass
řízení průtoku a koncentrace O2 a N2O - spřaženy min. fiO2 25%

8
Průtoky anest. plynů dříve : 2..4 l/min low flow pod 1 l/min
minimal flow pod 0,5l/min uzavřený systém mandatorní miminální průtok - 200ml/min O2 - minimální příkon O2 po zapnutí anest. přístroje

9
Odpařovače

10
Všechno je jinak … Desfluran

11
Dýchací okruh chlopeň vdechová manometr hadice Y spojka
volumetr pohlcovač CO2 přepadový ventil umožní znovu vdechovat plyn zbavený CO2 – low flow

12
chlopeň vdechová 1 směr

13
manometr tlak v dýchacích cestách 0..20 … (40) cm H2O
během ventilace obličejovou maskou „nepřekročit“ Esophageal Opening Pressure 20cm H2O

14
Y spojka, filtr, prodlužovací hadice

16
pohlcovač CO2

17
hadice

18
přepadový ventil adjustable Pressure Limiting (APL) valve
plně otevřen = 0,5 cm H2O uzavřen cm H2O

19
Dýchací okruh

20
Manometr tlak v manžetě tr.rourky/TS kanyly 20 - 30 cm H2O
tlak v manžetě LM do 40 cm H2O co nejméně, aby nebyl únik (ověřeno poslechem krku)
")
21
Ventilační část ventilátor (objemově řízená ventilace, (PCV) Vt 6 ml/kg, f dle CO2, PEEP 5, fiO manuálně - vak

22
Odtah anest. plynů přebytečné plyny mimo sál

24
Monitorace pacienta monere, "to warn" systematicky kontrolovat
..použitím smyslů a elektronických zařízení opakovaně nebo kontinuálně měřit proměnné anestezovaného pacienta.

25
Smysly klamou, ... … ale bez smyslů to nejde
Figure 30-1 Optical illusions. We perceive the circles to be different sizes because we infer the size by relative dimensions. The closeness of the smaller circles makes the inner circle appear smaller, and vice versa. The lines appear to be different sizes because we use straight-line perspective to estimate size and distance. This illusion reportedly does not work in cultures where straight lines are not used. Therefore, our internal perceptions lead us to err in estimating size and length. In the same way, the internal programming of our monitors can lead us to misinterpret results. Downloaded from: Miller's Anesthesia (on 12 March :22 PM) © 2007 Elsevier
 © 2007 Elsevier.")
26
Monitorace 1) trvalá přítomnost anesteziologa/sestry
Sledovat + hodnotit kontinuálně Airway + Breathing průchodné d.cesty kvalita dýchání, slyšitelné fenomeny, poslech Circulation kvalita a frekvence pulsu, prokrvení, barva sliznic hloubka anestezie ~ vědomí zornice, pocení, pohyb kk. Cíl: předejít problému

27
>>>> Alarm <<<<
< ?? co s ním ??> všimnout si interpretovat = vyhodnotit reagovat = něco změnit vypnout alarm? upravit hranice alarmu?

28
Fonendoskop + při anestezii okamžitě dostupný.
ventilační problém (bronchospasmus, laryngospasmus při LM) - SpO2, EtCO2 a EKG detekují problém snadněji než kontinuální poslech. Monitorace oběhu fonendoskopem – jen není-li dostupná elektronická monitorace.
 - SpO2, EtCO2 a EKG detekují problém snadněji než kontinuální poslech. Monitorace oběhu fonendoskopem – jen není-li dostupná elektronická monitorace.")
29
EKG srdeční frekvence rytmus extrasystoly ST změny - ischemie

30
Polohy elektrod

31
sinusový rytmus SVT: (není P, QRS štíhlé, pravidelná)
")
32
fisi nepravidelná akce, QRS štíhlé

33
komorový rytmus

34
elektrostimulace spike, komplex

35
EKG … tepová frekvence 45/min nebo 150/min nebo ??
Amann et al. BioMedical Engineering OnLine :60 doi: / X-4-60

36
EKG – komplikace monitorace
elektrické rušení jinými přístroji (pálení) přívodná šňůra kříží EKG kabel kabel jako anténa (smyčka) defibrilační výboj (norma povoluje 10s)
 přívodná šňůra kříží EKG kabel. kabel jako anténa (smyčka) defibrilační výboj (norma povoluje 10s)")
37
Princip měření NIBP Figure 32-2 Effect of cuff size on manual blood pressure measurement. An inappropriately small blood pressure cuff yields erroneously high values for blood pressure because the pressure within the cuff is incompletely transmitted to the underlying artery. Downloaded from: Miller's Anesthesia (on 12 March :22 PM) © 2007 Elsevier
 © 2007 Elsevier.")
38
Figure 32-3 Comparison of blood pressure measurements by Korotkoff sounds and oscillometry. Oscillometric systolic blood pressure is recorded at the point where cuff pressure oscillations begin to increase, mean pressure corresponds to the point of maximal oscillations, and diastolic pressure is measured when the oscillations become attenuated. Note the correspondence between these measurements and the Korotkoff sounds that determine auscultatory systolic and diastolic pressure. (Redrawn from Geddes LA: Cardiovascular Devices and Their Applications. New York John Wiley, 1984, Fig Reprinted by permission of John Wiley & Sons, Inc.) Downloaded from: Miller's Anesthesia (on 12 March :22 PM) © 2007 Elsevier
 © 2007 Elsevier.")
39
NIBP Nesnadné měření komplikace : třes, pohyb. aktivita bolest
Petechie Otok končetiny Venous stasis, thrombophlebitis Peripheral neuropathy Compartment syndrome Nesnadné měření třes, pohyb. aktivita bradykardie < 40/min obezita šok - vazokonstr.

40
IBP, kanylace arterie kontinuálně, real-time
očekávám ovlivnění oběhu farmaky / mechanicky opakované odběry krve selhání NIBP přídatná informace z pulzové křivky Pulse Pressure Variation

41
Figure 32-4 Percutaneous radial artery cannulation
Figure 32-4 Percutaneous radial artery cannulation. A, The wrist is positioned and the artery identified by palpation. B, The catheter-over-needle assembly is introduced through the skin and advanced toward the artery. C, Entry of the needle tip into the artery is identified by the flash of arterial blood in the needle hub reservoir. D, The needle-catheter assembly is advanced at a lower angle to ensure entry of the catheter tip into the vessel. E, If blood flow continues into the needle reservoir, the catheter is advanced gently over the needle into the artery. F, The catheter is attached to pressure monitoring tubing while maintaining proximal occlusive pressure on the artery. Downloaded from: Miller's Anesthesia (on 12 March :22 PM) © 2007 Elsevier
 © 2007 Elsevier.")
42
Měření invazivního tlaku
a. radialis / a. femoralis / a. brachialis arterie – hadička – komůrka – přetlaková manžeta s infuzí (trvalý proplach kanyly ml/h) kapalina je neztlačitelná X vzduch sraženina / zalomení zvyšuje odpor
 kapalina je neztlačitelná X vzduch. sraženina / zalomení zvyšuje odpor.")
43
!!Alarm!! Low BP Figure 32-1 Digital heart rate (HR) displays may fail to warn of dangerous bradyarrhythmias. Direct observation of the electrocardiogram (ECG) and the arterial blood pressure traces reveals complete heart block and a 4-second period of asystole, whereas the digital display reports an HR of 49 beats/min. Note that the ECG filter (arrow) corrects the baseline drift so that the trace remains on the recording screen. (From Mark JB: Atlas of Cardiovascular Monitoring. New York, Churchill Livingstone, 1998, Fig )
 displays may fail to warn of dangerous bradyarrhythmias. Direct observation of the electrocardiogram (ECG) and the arterial blood pressure traces reveals complete heart block and a 4-second period of asystole, whereas the digital display reports an HR of 49 beats/min. Note that the ECG filter (arrow) corrects the baseline drift so that the trace remains on the recording screen. (From Mark JB: Atlas of Cardiovascular Monitoring. New York, Churchill Livingstone, 1998, Fig )")
44
srdeční akce: 49/minutu, EKG: AV blokáda III

45
O2 v těle Figure 36-1 Oxygen transport cascade. A schematic view of the steps in oxygen transport from the atmosphere to the site of utilization in the mitochondrion is shown here. Approximate Po2 values are shown for each step in the cascade, and factors determining those partial pressures are shown within the square brackets. There is a distribution of tissue Po2 values depending on local capillary blood flow, tissue oxygen consumption, and diffusion distances. Mitochondrial Po2 values are depicted as a range because reported levels vary widely. (Adapted from Nunn JF: Nunn's Applied Respiratory Physiology, 4th ed. Boston, Butterworth-Heinemann, 1993.) Figure 36-1 Oxygen transport cascade. A schematic view of the steps in oxygen transport from the atmosphere to the site of utilization in the mitochondrion is shown here. Approximate Po2 values are shown for each step in the cascade, and factors determining those partial pressures are shown within the square brackets. There is a distribution of tissue Po2 values depending on local capillary blood flow, tissue oxygen consumption, and diffusion distances. Mitochondrial Po2 values are depicted as a range because reported levels vary widely. (Adapted from Nunn JF: Nunn's Applied Respiratory Physiology, 4th ed. Boston, Butterworth-Heinemann, 1993.) Downloaded from: Miller's Anesthesia (on 12 March :46 PM) © 2007 Elsevier
 Figure 36-1 Oxygen transport cascade. A schematic view of the steps in oxygen transport from the atmosphere to the site of utilization in the mitochondrion is shown here. Approximate Po2 values are shown for each step in the cascade, and factors determining those partial pressures are shown within the square brackets. There is a distribution of tissue Po2 values depending on local capillary blood flow, tissue oxygen consumption, and diffusion distances. Mitochondrial Po2 values are depicted as a range because reported levels vary widely. (Adapted from Nunn JF: Nunn s Applied Respiratory Physiology, 4th ed. Boston, Butterworth-Heinemann, 1993.) Downloaded from: Miller s Anesthesia (on 12 March :46 PM) © 2007 Elsevier.")
46
Oxygenace tkání monitorace O2 ve vdechovaném plynu SpO2 =saturace
Arteriální krevní plyny = „Astrup“ - analýza krve nízký srdeční výdej při dobré oxygenační fci plic

47
Saturace, SpO2 , „pulzák“ systémová arteriální saturace hemoglobinu kyslíkem určená pomocí pletyzmografické pulzní oxymetrie místa měření: prst ušní lalůček nosní křídlo ret

48
1000/s měření červenou, infrač. a „pozadí“ - světlo na sále
Odlišit pulzující = arteriální nepulzující = absorbci světla Figure Principle of pulse oximetry. Light passing through tissue containing blood is absorbed by tissue and by arterial, capillary, and venous blood. Usually, only the arterial blood is pulsatile. Light absorption may therefore be split into a pulsatile component (AC) and a constant or nonpulsatile component (DC). Hemoglobin O2 saturation may be obtained by application of Equation 19 in the text. (Data from Tremper KK, Barker SJ: Pulse oximetry. Anesthesiology 70:98, 1989.) Downloaded from: Miller's Anesthesia (on 19 March :18 PM) © 2007 Elsevier
 and a constant or nonpulsatile component (DC). Hemoglobin O2 saturation may be obtained by application of Equation 19 in the text. (Data from Tremper KK, Barker SJ: Pulse oximetry. Anesthesiology 70:98, 1989.) Downloaded from: Miller s Anesthesia (on 19 March :18 PM) © 2007 Elsevier.")
49
2 vlnové délky, 2absorbce pro Hb a HbO2
AC660 / DC660 S = odpovídá % HBO/(HB+HBO) AC940 / DC940 Figure Hemoglobin extinction curves. Pulse oximetry uses the wavelengths of 660 and 940 nm because they are available in solid-state emitters (not all wavelengths are able to be emitted from diodes). Unfortunately, HbCO and HbO2 absorb equally at 660 nm. Therefore, HbCO and HbO2 both read as Sao2 to a conventional pulse oximeter. In addition, Hbmet and reduced Hb share absorption at 660 nm and interfere with correct Sao2 measurement. (Courtesy of Susan Manson, Biox/Ohmeda, Boulder, Colorado, 1986.) Figure Hemoglobin extinction curves. Pulse oximetry uses the wavelengths of 660 and 940 nm because they are available in solid-state emitters (not all wavelengths are able to be emitted from diodes). Unfortunately, HbCO and HbO2 absorb equally at 660 nm. Therefore, HbCO and HbO2 both read as Sao2 to a conventional pulse oximeter. In addition, Hbmet and reduced Hb share absorption at 660 nm and interfere with correct Sao2 measurement. (Courtesy of Susan Manson, Biox/Ohmeda, Boulder, Colorado, 1986.) Downloaded from: Miller's Anesthesia (on 20 March :47 AM) © 2007 Elsevier
 AC940 / DC940. Figure Hemoglobin extinction curves. Pulse oximetry uses the wavelengths of 660 and 940 nm because they are available in solid-state emitters (not all wavelengths are able to be emitted from diodes). Unfortunately, HbCO and HbO2 absorb equally at 660 nm. Therefore, HbCO and HbO2 both read as Sao2 to a conventional pulse oximeter. In addition, Hbmet and reduced Hb share absorption at 660 nm and interfere with correct Sao2 measurement. (Courtesy of Susan Manson, Biox/Ohmeda, Boulder, Colorado, 1986.) Figure Hemoglobin extinction curves. Pulse oximetry uses the wavelengths of 660 and 940 nm because they are available in solid-state emitters (not all wavelengths are able to be emitted from diodes). Unfortunately, HbCO and HbO2 absorb equally at 660 nm. Therefore, HbCO and HbO2 both read as Sao2 to a conventional pulse oximeter. In addition, Hbmet and reduced Hb share absorption at 660 nm and interfere with correct Sao2 measurement. (Courtesy of Susan Manson, Biox/Ohmeda, Boulder, Colorado, 1986.) Downloaded from: Miller s Anesthesia (on 20 March :47 AM) © 2007 Elsevier.")
50
SpO2 – HbO2 - O2 ve tkáni od SpO2 90% níže klesá hodnota rychleji
PaO2 klesá konstantně nepřesnost 5% nehraje pro život roli !! pokles !!

51
Vliv chladu na SpO2 – posun v čase
Figure Effect of pulse oximeter probe replacement on delay from onset of hypoxemia to a drop in the measured Spo2. During cold-induced peripheral vasoconstriction in normal volunteers, the onset of hypoxemia was detected more quickly using an oximeter probe on the forehead compared with the finger. Other studies have shown a similar advantage for pulse oximeter probes placed on the ear. (From Bebout DE, Mannheimer PD, Wun C-C: Site-dependent differences in the time to detect changes in saturation during low perfusion. Crit Care Med 29:A115, 2002.) Downloaded from: Miller's Anesthesia (on 19 March :18 PM) © 2007 Elsevier
 Downloaded from: Miller s Anesthesia (on 19 March :18 PM) © 2007 Elsevier.")
52
Monitorace ventilace P,V, flow; PV křivka Analýza plynů O2,
EtCO2 – kapnometrie, kapnograf N2O, [%] volatilní anestetika

53
Figure 36-24 Flow (ordinate) versus volume (abscissa)
Figure Flow (ordinate) versus volume (abscissa). A, Closed-chest positive-pressure ventilation under general anesthesia in a patient with severe airways obstruction and hyperinflation before surgery to reduce lung volume. The flow-volume curve shows inspiratory (negative) and expiratory (positive) flow on the ordinate, plotted clockwise from zero volume on the abscissa. Expiratory flow started with a sharp upward peak and then fell immediately to a low flow rate with convexity toward the volume axis, suggesting expiratory flow limitation. expiratory flow rate was so low that inflation of the next positive-pressure breath was initiated before expiratory flow reached zero. Because expiratory flow continued up to this point, there must have been intrinsic positive end-expiratory pressure (PEEPi). B, A similar closed-check flow-volume curve after lung resection shows that the characteristic pattern of expiratory flow limitation has disappeared and that expiratory flow rate fell to zero before inflation started for the next breath (i.e., no suggestion of PEEPi). (Adapted from Dueck R: Assessment and monitoring of flow limitation and other parameters from flow/volume loops. J Clin Monit Comput 16:425, 2000.) Downloaded from: Miller's Anesthesia (on 19 March :18 PM) © 2007 Elsevier
 versus volume (abscissa). A, Closed-chest positive-pressure ventilation under general anesthesia in a patient with severe airways obstruction and hyperinflation before surgery to reduce lung volume. The flow-volume curve shows inspiratory (negative) and expiratory (positive) flow on the ordinate, plotted clockwise from zero volume on the abscissa. Expiratory flow started with a sharp upward peak and then fell immediately to a low flow rate with convexity toward the volume axis, suggesting expiratory flow limitation. expiratory flow rate was so low that inflation of the next positive-pressure breath was initiated before expiratory flow reached zero. Because expiratory flow continued up to this point, there must have been intrinsic positive end-expiratory pressure (PEEPi). B, A similar closed-check flow-volume curve after lung resection shows that the characteristic pattern of expiratory flow limitation has disappeared and that expiratory flow rate fell to zero before inflation started for the next breath (i.e., no suggestion of PEEPi). (Adapted from Dueck R: Assessment and monitoring of flow limitation and other parameters from flow/volume loops. J Clin Monit Comput 16:425, 2000.) Downloaded from: Miller s Anesthesia (on 19 March :18 PM) © 2007 Elsevier.")
54
PV křivka během kapnoperitonea
Figure 57-1 Change in total respiratory compliance during pneumoperitoneum for laparoscopic cholecystectomy. The intra-abdominal pressure was 14 mm Hg, and the head-up tilt was 10 degrees. The airway pressure (Paw) versus volume (V) curves and data were obtained from the screen of a Datex Ultima monitoring device. Curves are generated for before insufflation (A) and 30 minutes after insufflation (B). Values are given for tidal volume (TV, in mL); peak airway pressure (Ppeak, in cm H2O); plateau airway pressure (Pplat, in cm H2O); total respiratory compliance (C, in mL/cm H2O); and end-tidal carbon dioxide tension (PetCO2, in mm Hg). Downloaded from: Miller's Anesthesia (on 19 March :18 PM) © 2007 Elsevier
 versus volume (V) curves and data were obtained from the screen of a Datex Ultima monitoring device. Curves are generated for before insufflation (A) and 30 minutes after insufflation (B). Values are given for tidal volume (TV, in mL); peak airway pressure (Ppeak, in cm H2O); plateau airway pressure (Pplat, in cm H2O); total respiratory compliance (C, in mL/cm H2O); and end-tidal carbon dioxide tension (PetCO2, in mm Hg). Downloaded from: Miller s Anesthesia (on 19 March :18 PM) © 2007 Elsevier.")
55
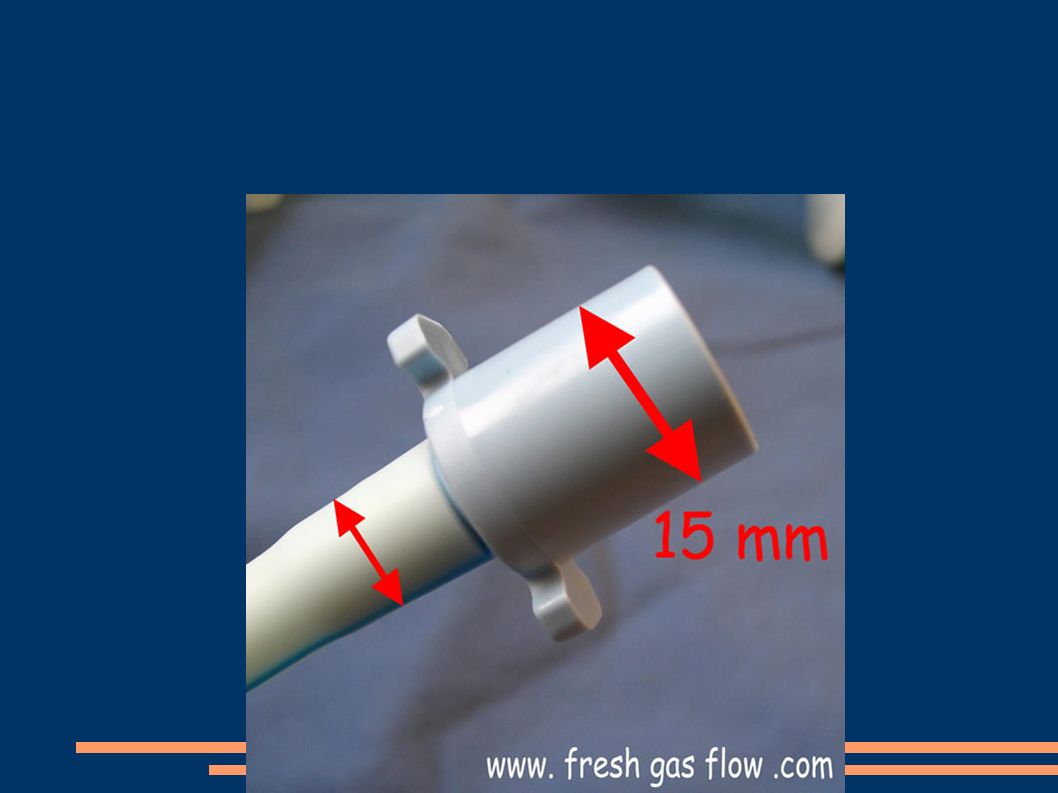
Monitorace dýchané směsi
Main-stream Side-stream jen CO2, méně přesné zpoždění lehké

56
Monitorace dýchané směsi
Main-stream Side-stream

57
O2 je paramagnetický (side stream monitor)
Minimální fiO2: 21% bezpečné 30% běžně : do 60% hypoxie, 100% preoxygenace 100% Figure Paramagnetic oxygen analyzer. Two sealed spheres filled with nitrogen are suspended in a magnetic field. Nitrogen (N2) is slightly diamagnetic, and the resting position of the beam is such that the spheres are displaced away from the strongest portion of the field. If the surrounding gas contains oxygen, the spheres are pushed further out of the field by the relatively paramagnetic oxygen. The magnitude of the torque is related to the paramagnetism of the gas mixture and is proportional to the partial pressure of oxygen (Po2). Movement of the dumbbell is detected by photocells, and a feedback current is applied to the coil encircling the spheres, returning the dumbbell to the zero position. The restoring current and output voltage are proportional to the Po2. (Courtesy of Servomex Co., Norwood, MA.) Downloaded from: Miller's Anesthesia (on 19 March :18 PM) © 2007 Elsevier
 is slightly diamagnetic, and the resting position of the beam is such that the spheres are displaced away from the strongest portion of the field. If the surrounding gas contains oxygen, the spheres are pushed further out of the field by the relatively paramagnetic oxygen. The magnitude of the torque is related to the paramagnetism of the gas mixture and is proportional to the partial pressure of oxygen (Po2). Movement of the dumbbell is detected by photocells, and a feedback current is applied to the coil encircling the spheres, returning the dumbbell to the zero position. The restoring current and output voltage are proportional to the Po2. (Courtesy of Servomex Co., Norwood, MA.) Downloaded from: Miller s Anesthesia (on 19 March :18 PM) © 2007 Elsevier.")
58
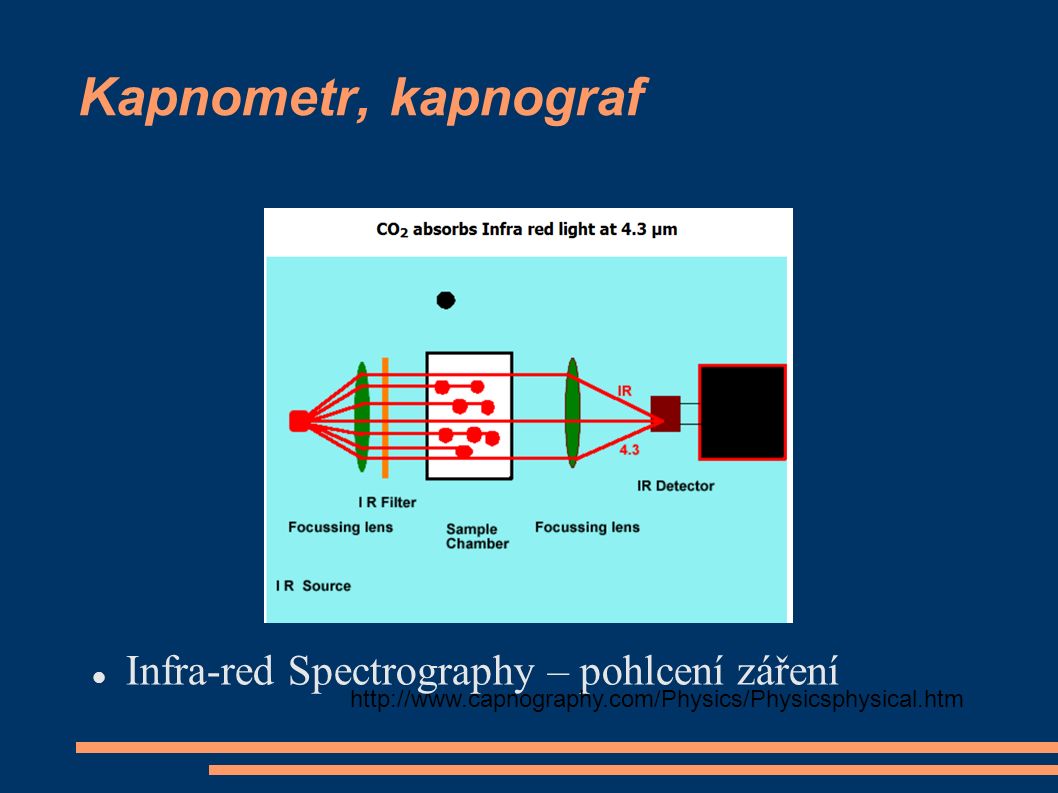
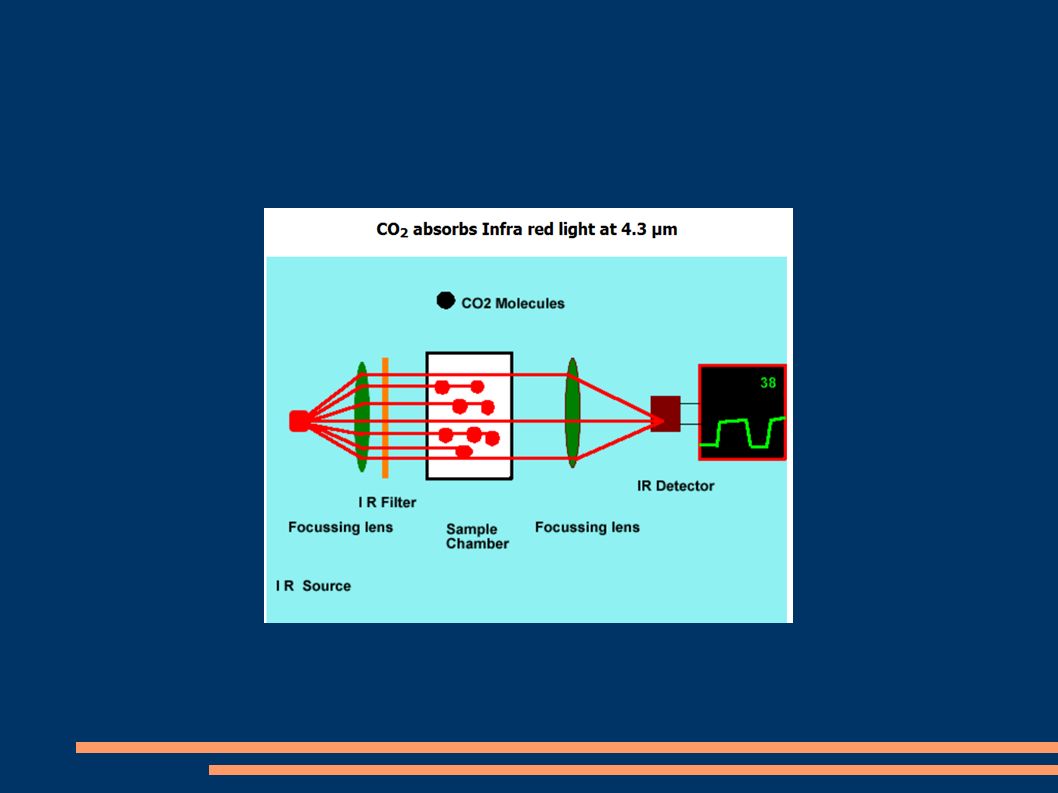
Kapnometr, kapnograf Infra-red Spectrography – pohlcení záření
60
CO2 emituje IR záření

61
Figure 36-18 Examples of capnograph waves
Figure Examples of capnograph waves. A, Normal spontaneous breathing. B, Normal mechanical ventilation. C, Prolonged exhalation during spontaneous breathing. As CO2 diffuses from the mixed venous blood into the alveoli, its concentration progressively rises (see Fig ). D, Increased slope of phase III in a mechanically ventilated patient with emphysema. E, Added dead space during spontaneous ventilation. F, Dual plateau (i.e. tails-up pattern) caused by a leak in the sample line.325 The alveolar plateau is artifactually low because of dilution of exhaled gas with air leaking inward. During each mechanical breath, the leak is reduced because of higher pressure within the airway and tubing, explaining the rise in the CO2 concentration at the end of the alveolar plateau. This pattern is not seen during spontaneous ventilation because the required increase in airway pressure is absent. G, Exhausted CO2 absorbent produces an inhaled CO2 concentration greater than zero. H, Double peak for a patient with a single lung transplant. The first peak represents CO2 from the transplanted (normal) lung. CO2 exhalation from the remaining (obstructed) lung is delayed, producing the second peak. I, Inspiratory valve stuck open during spontaneous breathing. Some backflow into the inspired limb of the circuit causes a rise in the level of inspired CO2. J, Inspiratory valve stuck open during mechanical ventilation. The "slurred" downslope during inspiration represents a small amount of inspired CO2 in the inspired limb of the circuit. K and L, Expiratory valve stuck open during spontaneous breathing or mechanical ventilation. Inhalation of exhaled gas causes an increase in inspired CO2. M, Cardiogenic oscillations, when seen, usually occur with sidestream capnographs for spontaneously breathing patients at the end of each exhalation. Cardiac action causes to-and-fro movement of the interface between exhaled and fresh gas. The CO2 concentration in gas entering the sampling line therefore alternates between high and low values. N, Electrical noise resulting from a malfunctioning component. The seemingly random nature of the signal perturbations (about three per second) implies a nonbiologic cause. Figure Examples of capnograph waves. A, Normal spontaneous breathing. B, Normal mechanical ventilation. C, Prolonged exhalation during spontaneous breathing. As CO2 diffuses from the mixed venous blood into the alveoli, its concentration progressively rises (see Fig ). D, Increased slope of phase III in a mechanically ventilated patient with emphysema. E, Added dead space during spontaneous ventilation. F, Dual plateau (i.e. tails-up pattern) caused by a leak in the sample line.325 The alveolar plateau is artifactually low because of dilution of exhaled gas with air leaking inward. During each mechanical breath, the leak is reduced because of higher pressure within the airway and tubing, explaining the rise in the CO2 concentration at the end of the alveolar plateau. This pattern is not seen during spontaneous ventilation because the required increase in airway pressure is absent. G, Exhausted CO2 absorbent produces an inhaled CO2 concentration greater than zero. H, Double peak for a patient with a single lung transplant. The first peak represents CO2 from the transplanted (normal) lung. CO2 exhalation from the remaining (obstructed) lung is delayed, producing the second peak. I, Inspiratory valve stuck open during spontaneous breathing. Some backflow into the inspired limb of the circuit causes a rise in the level of inspired CO2. J, Inspiratory valve stuck open during mechanical ventilation. The "slurred" downslope during inspiration represents a small amount of inspired CO2 in the inspired limb of the circuit. K and L, Expiratory valve stuck open during spontaneous breathing or mechanical ventilation. Inhalation of exhaled gas causes an increase in inspired CO2. M, Cardiogenic oscillations, when seen, usually occur with sidestream capnographs for spontaneously breathing patients at the end of each exhalation. Cardiac action causes to-and-fro movement of the interface between exhaled and fresh gas. The CO2 concentration in gas entering the sampling line therefore alternates between high and low values. N, Electrical noise resulting from a malfunctioning component. The seemingly random nature of the signal perturbations (about three per second) implies a nonbiologic cause. Downloaded from: Miller's Anesthesia (on 19 March :18 PM) © 2007 Elsevier
. D, Increased slope of phase III in a mechanically ventilated patient with emphysema. E, Added dead space during spontaneous ventilation. F, Dual plateau (i.e. tails-up pattern) caused by a leak in the sample line.325 The alveolar plateau is artifactually low because of dilution of exhaled gas with air leaking inward. During each mechanical breath, the leak is reduced because of higher pressure within the airway and tubing, explaining the rise in the CO2 concentration at the end of the alveolar plateau. This pattern is not seen during spontaneous ventilation because the required increase in airway pressure is absent. G, Exhausted CO2 absorbent produces an inhaled CO2 concentration greater than zero. H, Double peak for a patient with a single lung transplant. The first peak represents CO2 from the transplanted (normal) lung. CO2 exhalation from the remaining (obstructed) lung is delayed, producing the second peak. I, Inspiratory valve stuck open during spontaneous breathing. Some backflow into the inspired limb of the circuit causes a rise in the level of inspired CO2. J, Inspiratory valve stuck open during mechanical ventilation. The slurred downslope during inspiration represents a small amount of inspired CO2 in the inspired limb of the circuit. K and L, Expiratory valve stuck open during spontaneous breathing or mechanical ventilation. Inhalation of exhaled gas causes an increase in inspired CO2. M, Cardiogenic oscillations, when seen, usually occur with sidestream capnographs for spontaneously breathing patients at the end of each exhalation. Cardiac action causes to-and-fro movement of the interface between exhaled and fresh gas. The CO2 concentration in gas entering the sampling line therefore alternates between high and low values. N, Electrical noise resulting from a malfunctioning component. The seemingly random nature of the signal perturbations (about three per second) implies a nonbiologic cause. Figure Examples of capnograph waves. A, Normal spontaneous breathing. B, Normal mechanical ventilation. C, Prolonged exhalation during spontaneous breathing. As CO2 diffuses from the mixed venous blood into the alveoli, its concentration progressively rises (see Fig ). D, Increased slope of phase III in a mechanically ventilated patient with emphysema. E, Added dead space during spontaneous ventilation. F, Dual plateau (i.e. tails-up pattern) caused by a leak in the sample line.325 The alveolar plateau is artifactually low because of dilution of exhaled gas with air leaking inward. During each mechanical breath, the leak is reduced because of higher pressure within the airway and tubing, explaining the rise in the CO2 concentration at the end of the alveolar plateau. This pattern is not seen during spontaneous ventilation because the required increase in airway pressure is absent. G, Exhausted CO2 absorbent produces an inhaled CO2 concentration greater than zero. H, Double peak for a patient with a single lung transplant. The first peak represents CO2 from the transplanted (normal) lung. CO2 exhalation from the remaining (obstructed) lung is delayed, producing the second peak. I, Inspiratory valve stuck open during spontaneous breathing. Some backflow into the inspired limb of the circuit causes a rise in the level of inspired CO2. J, Inspiratory valve stuck open during mechanical ventilation. The slurred downslope during inspiration represents a small amount of inspired CO2 in the inspired limb of the circuit. K and L, Expiratory valve stuck open during spontaneous breathing or mechanical ventilation. Inhalation of exhaled gas causes an increase in inspired CO2. M, Cardiogenic oscillations, when seen, usually occur with sidestream capnographs for spontaneously breathing patients at the end of each exhalation. Cardiac action causes to-and-fro movement of the interface between exhaled and fresh gas. The CO2 concentration in gas entering the sampling line therefore alternates between high and low values. N, Electrical noise resulting from a malfunctioning component. The seemingly random nature of the signal perturbations (about three per second) implies a nonbiologic cause. Downloaded from: Miller s Anesthesia (on 19 March :18 PM) © 2007 Elsevier.")
62
Normální dýchání spont. řízené
Figure Examples of capnograph waves. A, Normal spontaneous breathing. B, Normal mechanical ventilation. C, Prolonged exhalation during spontaneous breathing. As CO2 diffuses from the mixed venous blood into the alveoli, its concentration progressively rises (see Fig ). D, Increased slope of phase III in a mechanically ventilated patient with emphysema. E, Added dead space during spontaneous ventilation. F, Dual plateau (i.e. tails-up pattern) caused by a leak in the sample line.325 The alveolar plateau is artifactually low because of dilution of exhaled gas with air leaking inward. During each mechanical breath, the leak is reduced because of higher pressure within the airway and tubing, explaining the rise in the CO2 concentration at the end of the alveolar plateau. This pattern is not seen during spontaneous ventilation because the required increase in airway pressure is absent. G, Exhausted CO2 absorbent produces an inhaled CO2 concentration greater than zero. H, Double peak for a patient with a single lung transplant. The first peak represents CO2 from the transplanted (normal) lung. CO2 exhalation from the remaining (obstructed) lung is delayed, producing the second peak. I, Inspiratory valve stuck open during spontaneous breathing. Some backflow into the inspired limb of the circuit causes a rise in the level of inspired CO2. J, Inspiratory valve stuck open during mechanical ventilation. The "slurred" downslope during inspiration represents a small amount of inspired CO2 in the inspired limb of the circuit. K and L, Expiratory valve stuck open during spontaneous breathing or mechanical ventilation. Inhalation of exhaled gas causes an increase in inspired CO2. M, Cardiogenic oscillations, when seen, usually occur with sidestream capnographs for spontaneously breathing patients at the end of each exhalation. Cardiac action causes to-and-fro movement of the interface between exhaled and fresh gas. The CO2 concentration in gas entering the sampling line therefore alternates between high and low values. N, Electrical noise resulting from a malfunctioning component. The seemingly random nature of the signal perturbations (about three per second) implies a nonbiologic cause. Downloaded from: Miller's Anesthesia (on 19 March :18 PM) © 2007 Elsevier
. D, Increased slope of phase III in a mechanically ventilated patient with emphysema. E, Added dead space during spontaneous ventilation. F, Dual plateau (i.e. tails-up pattern) caused by a leak in the sample line.325 The alveolar plateau is artifactually low because of dilution of exhaled gas with air leaking inward. During each mechanical breath, the leak is reduced because of higher pressure within the airway and tubing, explaining the rise in the CO2 concentration at the end of the alveolar plateau. This pattern is not seen during spontaneous ventilation because the required increase in airway pressure is absent. G, Exhausted CO2 absorbent produces an inhaled CO2 concentration greater than zero. H, Double peak for a patient with a single lung transplant. The first peak represents CO2 from the transplanted (normal) lung. CO2 exhalation from the remaining (obstructed) lung is delayed, producing the second peak. I, Inspiratory valve stuck open during spontaneous breathing. Some backflow into the inspired limb of the circuit causes a rise in the level of inspired CO2. J, Inspiratory valve stuck open during mechanical ventilation. The slurred downslope during inspiration represents a small amount of inspired CO2 in the inspired limb of the circuit. K and L, Expiratory valve stuck open during spontaneous breathing or mechanical ventilation. Inhalation of exhaled gas causes an increase in inspired CO2. M, Cardiogenic oscillations, when seen, usually occur with sidestream capnographs for spontaneously breathing patients at the end of each exhalation. Cardiac action causes to-and-fro movement of the interface between exhaled and fresh gas. The CO2 concentration in gas entering the sampling line therefore alternates between high and low values. N, Electrical noise resulting from a malfunctioning component. The seemingly random nature of the signal perturbations (about three per second) implies a nonbiologic cause. Downloaded from: Miller s Anesthesia (on 19 March :18 PM) © 2007 Elsevier.")
64
obstrukce d.c. expirium inspirium

65
zdravé plíce, alveoly vyprázdněny současně
Různá ventilace alveolů nejprve vyprázdněny dobře ventilované pak špatně ventilované Figure Mechanisms of airways obstruction producing an upsloping phase III capnogram. In a normal, healthy person (upper panel), there is a narrow range of [Vdot]a/[Qdot] ratios with values close to 1. Gas exchange units therefore have similar Pco2 and tend to empty synchronously, and the expired Pco2 remains relatively constant. During the course of exhalation, the alveolar Pco2 slowly rises as CO2 continuously diffuses from the blood. This causes a slight increase in Pco2 toward the end of expiration, and this increase can be pronounced if the exhalation is prolonged (see Fig C). In a patient with diffuse airways obstruction (lower panel), the airway pathology is heterogeneous, with gas exchange units having a wide range of [Vdot]a/[Qdot] ratios. Well-ventilated gas exchange units, with gas containing a lower Pco2, empty first; poorly ventilated units, with a higher Pco2, empty last. In addition to the continuous rise in Pco2 mentioned previously, there is a progressive increase caused by asynchronous exhalation. Downloaded from: Miller's Anesthesia (on 19 March :18 PM) © 2007 Elsevier
, there is a narrow range of [Vdot]a/[Qdot] ratios with values close to 1. Gas exchange units therefore have similar Pco2 and tend to empty synchronously, and the expired Pco2 remains relatively constant. During the course of exhalation, the alveolar Pco2 slowly rises as CO2 continuously diffuses from the blood. This causes a slight increase in Pco2 toward the end of expiration, and this increase can be pronounced if the exhalation is prolonged (see Fig C). In a patient with diffuse airways obstruction (lower panel), the airway pathology is heterogeneous, with gas exchange units having a wide range of [Vdot]a/[Qdot] ratios. Well-ventilated gas exchange units, with gas containing a lower Pco2, empty first; poorly ventilated units, with a higher Pco2, empty last. In addition to the continuous rise in Pco2 mentioned previously, there is a progressive increase caused by asynchronous exhalation. Downloaded from: Miller s Anesthesia (on 19 March :18 PM) © 2007 Elsevier.")
66
CO2 při kapnoperitoneu Figure 57-2 Ventilatory changes (pH, Paco2, and PetCO2) during CO2 pneumoperitoneum for laparoscopic cholecystectomy. For 13 American Society of Anesthesiologists (ASA) class I and II patients, minute ventilation was kept constant at 100 mL/kg/min with a respiratory rate of 12 per minute during the study. Intra-abdominal pressure was 14 mm Hg. Data are given as the mean ± SEM.*, P .05 compared with time 0. Downloaded from: Miller's Anesthesia (on 19 March :18 PM) © 2007 Elsevier
 during CO2 pneumoperitoneum for laparoscopic cholecystectomy. For 13 American Society of Anesthesiologists (ASA) class I and II patients, minute ventilation was kept constant at 100 mL/kg/min with a respiratory rate of 12 per minute during the study. Intra-abdominal pressure was 14 mm Hg. Data are given as the mean ± SEM.*, P .05 compared with time 0. Downloaded from: Miller s Anesthesia (on 19 March :18 PM) © 2007 Elsevier.")
67
Figure 36-20 The effect ofNaHCO3- administration on end-tidal Pco2
Figure The effect ofNaHCO3- administration on end-tidal Pco2. A continuous tracing of end-tidal Pco2 is shown as a function of time. Intravenous administration of 50 mEq followed by 30 mEq of NaHCO3 results in an abrupt increase in expired CO2 because of neutralization of bicarbonate by hydrogen ions. Downloaded from: Miller's Anesthesia (on 19 March :18 PM) © 2007 Elsevier
 © 2007 Elsevier.")
68
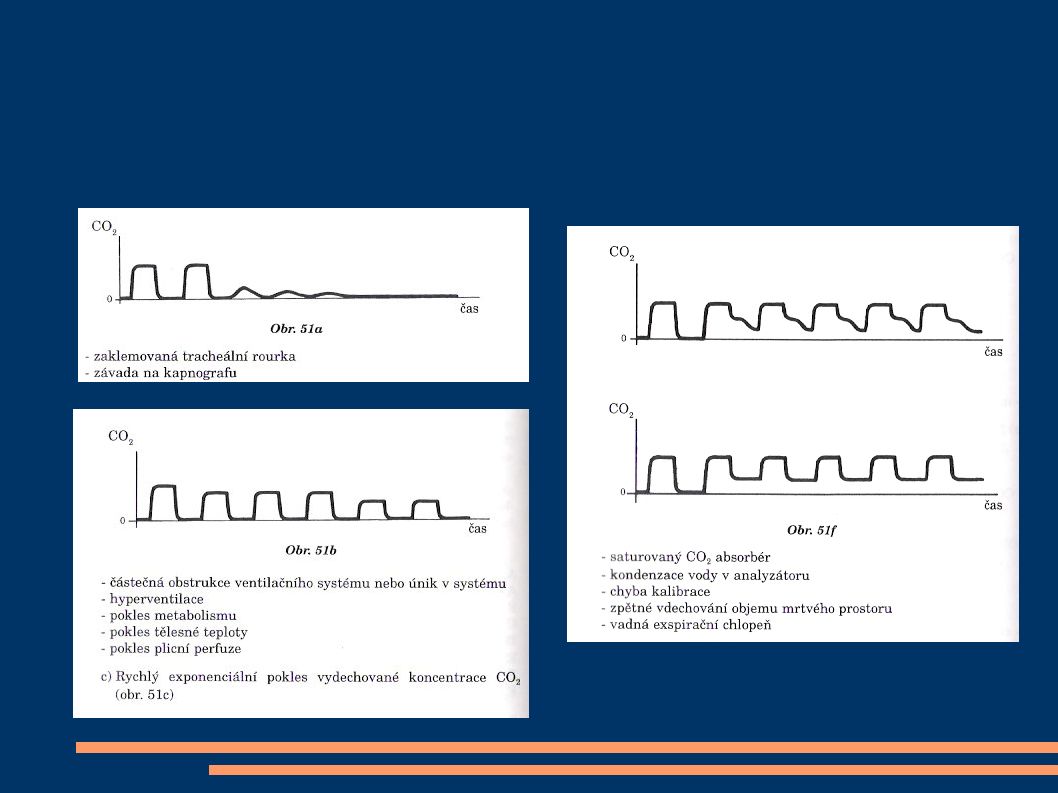
Kapnograf Náhlý pokles na 0: zaklemovaná, zalomená trach.rourka
porucha kapnografu Postupný pokles: částečná obstrukce hyperventilace pokles metabolismu pokles perfuze plic Nulové etCO2 intubace do jícnu

69
Monitorace tělesné teploty
u výkonů delších 60 minut aktivní ohřívání – podložkou, prouděním teplého vzduchu

70
redistribuce tepla periferní vazodilatace
snížená tvorba tepla a stacionární ztráty do okolí ustálený stav Figure 40-7 Hypothermia during general anesthesia develops with a characteristic pattern. An initial rapid decrease in core temperature results from a core-to-peripheral redistribution of body heat. This redistribution is followed by a slow, linear reduction in core temperature that results simply from heat loss exceeding heat production. Finally, core temperature stabilizes and subsequently remains virtually unchanged. This plateau phase may be a passive thermal steady state or might result when sufficient hypothermia triggers thermoregulatory vasoconstriction. Results are presented as means ± SD. Downloaded from: Miller's Anesthesia (on 19 March :18 PM) © 2007 Elsevier
 © 2007 Elsevier.")
71
15 minutes po EPI anestezii pokles teploty jádra, vzestup pocitu tepelné pohody (visual analog scale -VAS). Interestingly, however, maximal thermal comfort coincided with the minimum core temperature. Tympanálně měřená teplota. (Redrawn with modification from Sessler DI, Ponte J: Shivering during epidural anesthesia. Anesthesiology 72: , 1990.) Downloaded from: Miller's Anesthesia (on 19 March :18 PM) © 2007 Elsevier
 © 2007 Elsevier.")
72
Monitorace nervosvalové blokády
single-twitch train-of-four (TOF) tetanic, post-tetanic count (PTC) double-burst stimulation (DBS)
 tetanic, post-tetanic count (PTC) double-burst stimulation (DBS)")
73
Single-twitch 1Hz .. 0,1Hz, kontinuálně
Figure 39-1 Pattern of electrical stimulation and evoked muscle responses to single-twitch nerve stimulation (at frequencies of 0.1 to 1.0 Hz) after injection of nondepolarizing (Non-dep) and depolarizing (Dep) neuromuscular blocking drugs (arrows). Note that except for the difference in time factors, no differences in the strength of the evoked responses exist between the two types of block. Downloaded from: Miller's Anesthesia (on 12 March :46 PM)
 after injection of nondepolarizing (Non-dep) and depolarizing (Dep) neuromuscular blocking drugs (arrows). Note that except for the difference in time factors, no differences in the strength of the evoked responses exist between the two types of block. Downloaded from: Miller s Anesthesia (on 12 March :46 PM)")
74
TOF 4 stimuly á 0,5s (2Hz) Figure 39-2 Pattern of electrical stimulation and evoked muscle responses to TOF nerve stimulation before and after injection of nondepolarizing (Non-dep) and depolarizing (Dep) neuromuscular blocking drugs (arrows). Downloaded from: Miller's Anesthesia (on 12 March :46 PM)
 and depolarizing (Dep) neuromuscular blocking drugs (arrows). Downloaded from: Miller s Anesthesia (on 12 March :46 PM)")
75
Tetanická stimulace bolestivá; 50Hz na 5s

76
Posttetanická facilitace
Figure 39-3 Pattern of stimulation and evoked muscle responses to tetanic (50-Hz) nerve stimulation for 5 seconds (Te) and post-tetanic stimulation (1.0-Hz) twitch. Stimulation was applied before injection of neuromuscular blocking drugs and during moderate nondepolarizing and depolarizing blocks. Note fade in the response to tetanic stimulation, plus post-tetanic facilitation of transmission during nondepolarizing blockade. During depolarizing blockade, the tetanic response is well sustained and no post-tetanic facilitation of transmission occurs. Downloaded from: Miller's Anesthesia (on 12 March :46 PM) © 2007 Elsevier
 nerve stimulation for 5 seconds (Te) and post-tetanic stimulation (1.0-Hz) twitch. Stimulation was applied before injection of neuromuscular blocking drugs and during moderate nondepolarizing and depolarizing blocks. Note fade in the response to tetanic stimulation, plus post-tetanic facilitation of transmission during nondepolarizing blockade. During depolarizing blockade, the tetanic response is well sustained and no post-tetanic facilitation of transmission occurs. Downloaded from: Miller s Anesthesia (on 12 March :46 PM) © 2007 Elsevier.")
77
Figure 39-4 Pattern of electrical stimulation and evoked muscle responses to TOF nerve stimulation, 50-Hz tetanic nerve stimulation for 5 seconds (TE), and 1.0-Hz post-tetanic twitch stimulation (PTS) during four different levels of nondepolarizing neuromuscular blockade. During very intense blockade of the peripheral muscles (A), no response to any of the forms of stimulation occurs. During less pronounced blockade (B and C), there is still no response to stimulation, but post-tetanic facilitation of transmission is present. During surgical block (D), the first response to TOF appears and post-tetanic facilitation increases further. The post-tetanic count (see text) is 1 during intense block (B), 3 during less intense block (C), and 8 during surgical block (D). Downloaded from: Miller's Anesthesia (on 12 March :46 PM) © 2007 Elsevier
 © 2007 Elsevier.")
78
Double-burst stimulation
2 krátké sekvence 50-Hz tetanické stimulace, odděleny pauzou 750 ms nerelaxovaný sval – 2 stejně silné kontrakce částečné relaxovaný sval – 2. je slabší

79
Figure 39-7 Pattern of electrical stimulation and evoked muscle responses to TOF nerve stimulation and double-burst nerve stimulation (i.e., three impulses in each of two tetanic bursts, DBS3,3) before injection of muscle relaxants (control) and during recovery from nondepolarizing neuromuscular blockade. TOF ratio is the amplitude of the fourth response to TOF divided by the amplitude of the first response. DBS3,3 ratio is the amplitude of the second response to DBS3,3 divided by the amplitude of the first response. (See text for further explanation.) Downloaded from: Miller's Anesthesia (on 12 March :47 PM) © 2007 Elsevier
 © 2007 Elsevier.")
80
Sledované parametry anest. přístroje
hmotnost palice tloušťka a počet polštářů

81
Sledované parametry anest. přístroje
tlaky v Centrálním rozvodu / tlak. lahvích funkce ventilátoru (vlnovec se vrací až nahoru)
")
82
Bdělost při CA Bdělost je pooperační vzpomínka na události během celkové anestezie 0,1 – 0,2% operované populace (1:800) mimotělní oběh císařský řez trauma reportují: pocit svalové relaxace, nemožnost pohybu konverzace strach, bolest, bezmoc

84
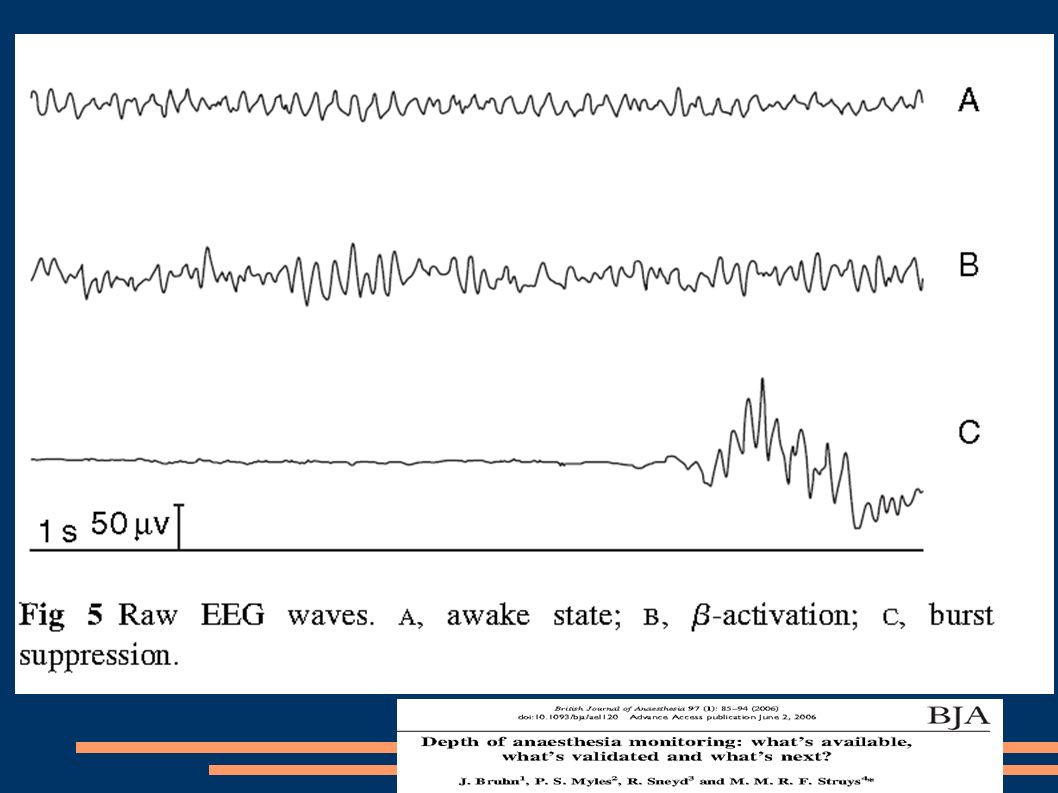
Monitorace hloubky bezvědomí
EEG – matematika → BIS .. číslo charakterizující bdělost

86
Příště .... farmakologie

Podobné prezentace


, Ω(n 2 ), Θ(n·log 2 (n)), … Různé algoritmy mají různou složitost: O(n), Ω(n 2 ), Θ(n·log.>")


