Stáhnout prezentaci
Prezentace se nahrává, počkejte prosím

1
Evoluce 9/2014 Kybernetika a rozumění

3
stroje mechanické a chemické programované

4
256 protonů/otočku

6
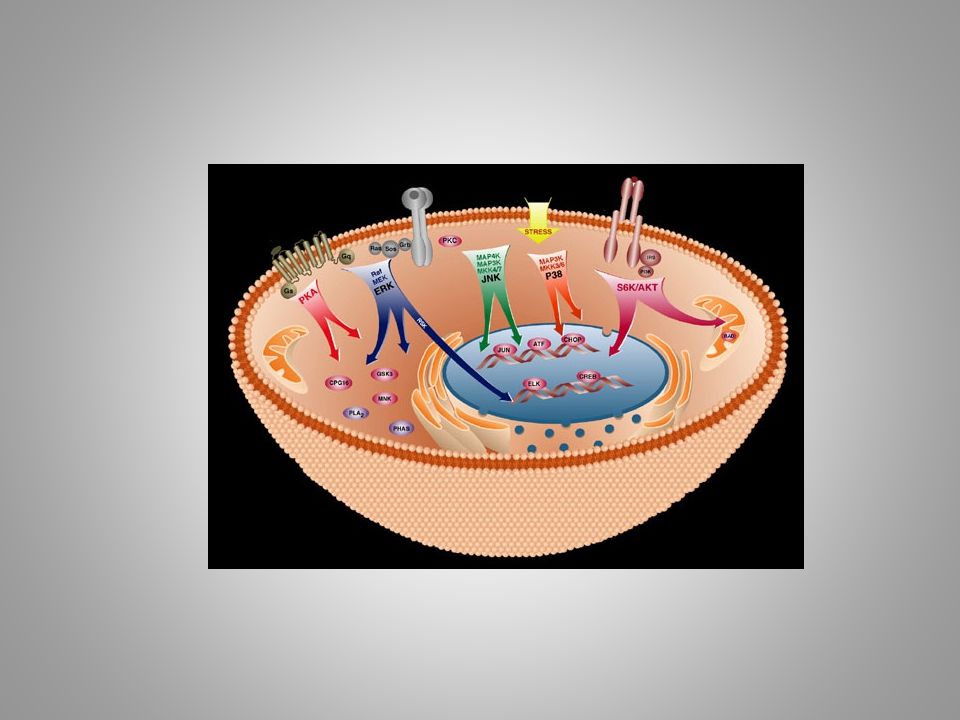
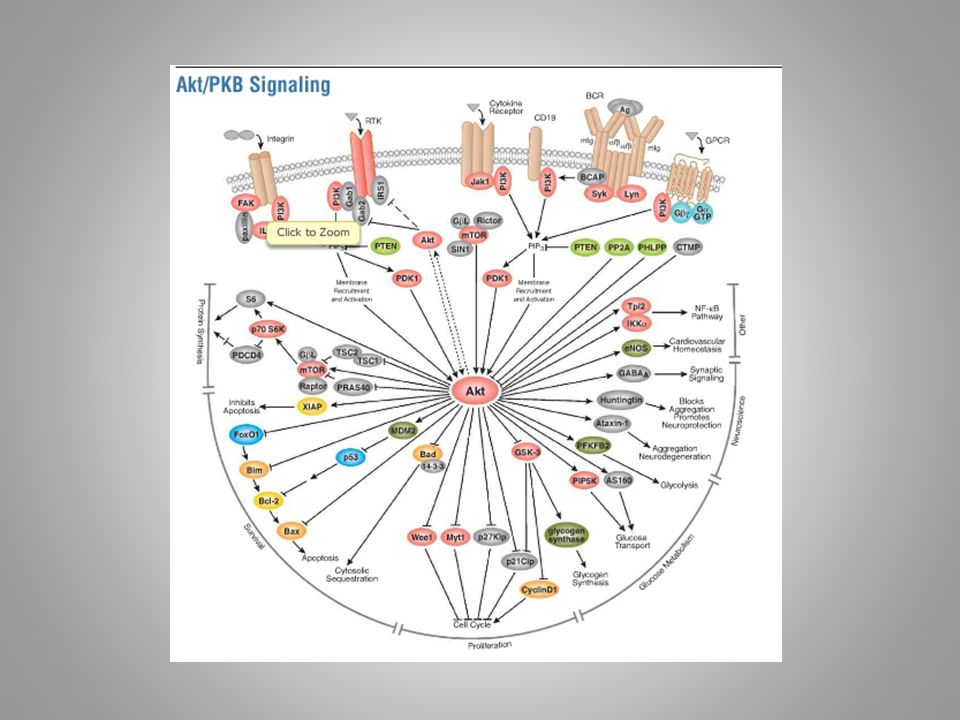
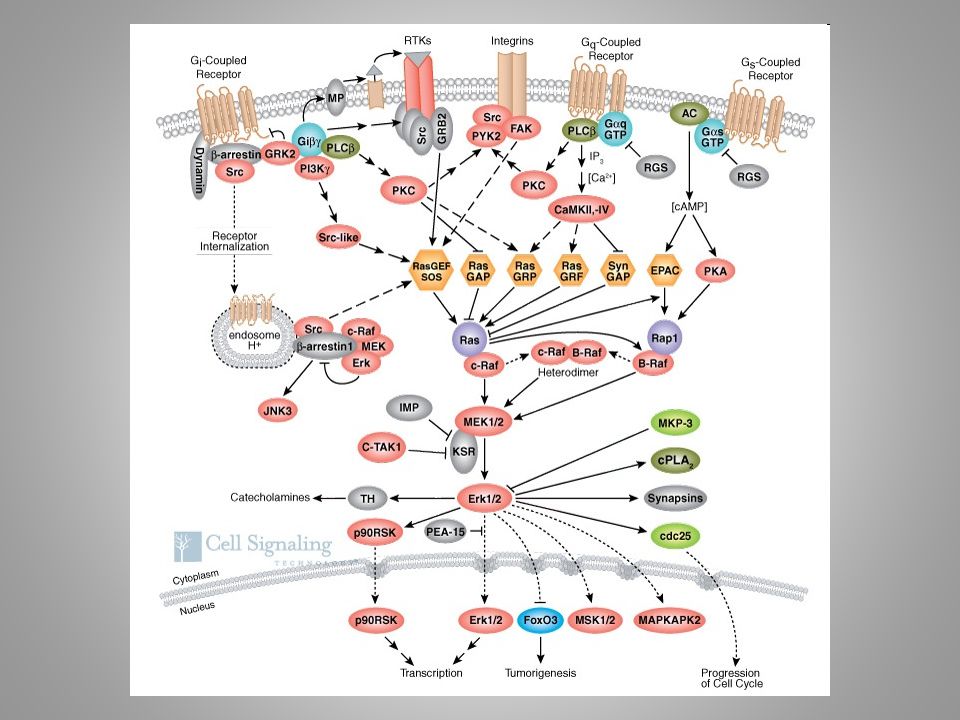
stroje mechanické a chemické programované gramatika (sémantika) – nauka o uspořádání („jak“ to je) sémiotika – nauka o významu („o čem“ to je) (zelené pole)
 – nauka o uspořádání („jak to je) sémiotika – nauka o významu („o čem to je) (zelené pole)")
7
stroje mechanické a chemické programované gramatika (sémantika) – nauka o uspořádání sémiotika – nauka o významu signál x znak
 – nauka o uspořádání sémiotika – nauka o významu signál x znak")
8
stroje mechanické a chemické programované gramatika (sémantika) – nauka o uspořádání sémiotika – nauka o významu signál x znak (nosič znaku x znak sám)
 – nauka o uspořádání sémiotika – nauka o významu signál x znak (nosič znaku x znak sám)")
10
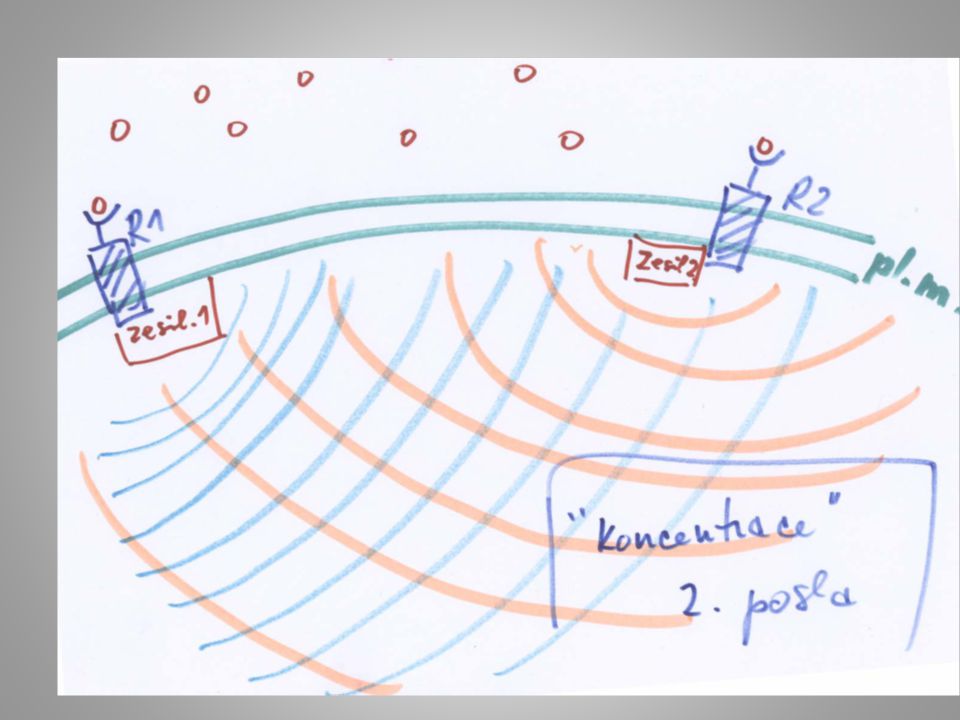
(3 fáze receptoru)
")
12
gratuita (J. Monod)
")
17
ENCODE = ENCyclopedia Of Dna Elements

18
ENCODE, Nature + Genome Biol. + Genome Res.: 30 papers, Sept. 6, 2012; „Search machines“

19
ENCODE 147 cell types, 80% of the genome DNA methylation Open chromatin RNA binding of reg. proteins RNA sequences ChIP-sequencing Histone modification Transcription factors

20
70 000 „promoters“ 400 000 „enhancers“ About 10% of the stuff Binding sites for 120 transcription factors Dnase I sites: 2.9 millions; only 3700 in all cell types 1/3 only in one cell type

21
The level of redness denotes the relative number of CpG Islands that can be located on the chromosome in that region. Click on the image for an enlarged version.

24
ARTKQ TARKS TGGKA PRKQL ATKAA RKSA AρTκQ TARασ TGGKA PRKQL ATKAA RμSA ARTλQ TARKS TGGKA πRKQL ATKAA RKSA ARTμQ TARλS TGGKA PRKQL AτKAA RλSA ARTKQ TARKσ TGGKA PρKQL ATKAA RKSA ARTαQ TARηS TGGKA ωRKQL ATKAA RμSA

25
© 2012 Nature Publishing Group. Published by Nature Publishing Group.2 Figure 8 Figure 8 | Allele-specific ENCODE elements.a, Representative allele-specific information from GM12878 cells for selected assays around the first exon of the NACC2 gene (genomic region Chr9: 138950000-138995000, GRCh37). Transcription signal is shown in green, and the three sections show allele- specific data for three data sets (POLR2A, H3K79me2 and H3K27me3 ChIP-seq). In each case the purple signal is the processed signal for all sequence reads for the assay, whereas the blue and red signals show sequence reads specifically assigned to either the paternal or maternal copies of the genome, respectively. The set of common SNPs from dbSNP, including the phased, heterozygous SNPs used to provide the assignment, are shown at the bottom of the panel. NACC2 has a statistically significant paternal bias for POLR2A and the transcription- associated mark H3K79me2, and has a significant maternal bias for the repressive mark H3K27me3. b, Pair-wise correlations of allele-specific signal within single genes (below the diagonal) or within individual ChromHMM segments across the whole genome for selected DNase-seq and histone modification and transcription factor ChIP-seq assays. The extent of correlation is coloured according to the heat-map scale indicated from positive correlation (red) through to anti-correlation (blue). An interactive version of this figure is available in the online version of the paper.
. Transcription signal is shown in green, and the three sections show allele- specific data for three data sets (POLR2A, H3K79me2 and H3K27me3 ChIP-seq). In each case the purple signal is the processed signal for all sequence reads for the assay, whereas the blue and red signals show sequence reads specifically assigned to either the paternal or maternal copies of the genome, respectively. The set of common SNPs from dbSNP, including the phased, heterozygous SNPs used to provide the assignment, are shown at the bottom of the panel. NACC2 has a statistically significant paternal bias for POLR2A and the transcription- associated mark H3K79me2, and has a significant maternal bias for the repressive mark H3K27me3. b, Pair-wise correlations of allele-specific signal within single genes (below the diagonal) or within individual ChromHMM segments across the whole genome for selected DNase-seq and histone modification and transcription factor ChIP-seq assays. The extent of correlation is coloured according to the heat-map scale indicated from positive correlation (red) through to anti-correlation (blue). An interactive version of this figure is available in the online version of the paper..")
26
domény v chromatinu

27
© 2012 Nature Publishing Group. Published by Nature Publishing Group.2 Figure 1 Figure 1 | Impact of selection on ENCODE functional elements in mammals and human populations.a, Levels of pan-mammalian constraint (mean GERP score; 24 mammals 8, x axis) compared to diversity, a measure of negative selection in the human population (mean expected heterozygosity, inverted scale, y axis) for ENCODE data sets. Each point is an average for a single data set. The top-right corners have the strongest evolutionary constraint and lowest diversity. Coding (C), UTR (U), genomic (G), intergenic (IG) and intronic (IN) averages are shown as filled squares. In each case the vertical and horizontal cross hairs show representative levels for the neutral expectation for mammalian conservation and human population diversity, respectively. The spread over all non-exonic ENCODE elements greater than 2.5 kb from TSSs is shown. The inner dashed box indicates that parts of the plot have been magnified for the surrounding outer panels, although the scales in the outer plots provide the exact regions and dimensions magnified. The spread for DHS sites (b) and RNA elements (d) is shown in the plots on the left. RNA elements are either long novel intronic (dark green) or long intergenic (light green) RNAs. The horizontal cross hairs are colour-coded to the relevant data set in d. c, Spread of transcription factor motif instances either in regions bound by the transcription factor (orange points) or in the corresponding unbound motif matches in grey, with bound and unbound points connected with an arrow in each case showing that bound sites are generally more constrained and less diverse. e, Derived allele frequency spectrum for primate-specific elements, with variations outside ENCODE elements in black and variations covered by ENCODE elements in red. The increase in low-frequency alleles compared to background is indicative of negative selection occurring in the set of variants annotated by the ENCODE data. f, Aggregation of mammalian constraint scores over the glucocorticoid receptor (GR) transcription factor motif in bound sites, showing the expected correlation with the information content of bases in the motif. An interactive version of this figure is available in the online version of the paper.
 compared to diversity, a measure of negative selection in the human population (mean expected heterozygosity, inverted scale, y axis) for ENCODE data sets. Each point is an average for a single data set. The top-right corners have the strongest evolutionary constraint and lowest diversity. Coding (C), UTR (U), genomic (G), intergenic (IG) and intronic (IN) averages are shown as filled squares. In each case the vertical and horizontal cross hairs show representative levels for the neutral expectation for mammalian conservation and human population diversity, respectively. The spread over all non-exonic ENCODE elements greater than 2.5 kb from TSSs is shown. The inner dashed box indicates that parts of the plot have been magnified for the surrounding outer panels, although the scales in the outer plots provide the exact regions and dimensions magnified. The spread for DHS sites (b) and RNA elements (d) is shown in the plots on the left. RNA elements are either long novel intronic (dark green) or long intergenic (light green) RNAs. The horizontal cross hairs are colour-coded to the relevant data set in d. c, Spread of transcription factor motif instances either in regions bound by the transcription factor (orange points) or in the corresponding unbound motif matches in grey, with bound and unbound points connected with an arrow in each case showing that bound sites are generally more constrained and less diverse. e, Derived allele frequency spectrum for primate-specific elements, with variations outside ENCODE elements in black and variations covered by ENCODE elements in red. The increase in low-frequency alleles compared to background is indicative of negative selection occurring in the set of variants annotated by the ENCODE data. f, Aggregation of mammalian constraint scores over the glucocorticoid receptor (GR) transcription factor motif in bound sites, showing the expected correlation with the information content of bases in the motif. An interactive version of this figure is available in the online version of the paper..")
28
© 2012 Nature Publishing Group. Published by Nature Publishing Group.3 Figure 1 The accessible chromatin landscape of the human genome. Nature. 489(7414):75-82, September 6, 2012. DOI: 10.1038/nature11232 Figure 1 | General features of the DHS landscape. a, Density of DNase I cleavage sites for selected cell types, shown for an example ~350-kb region. Two regions are shown to the right in greater detail. b, Left: distribution of 2,890,742 DHSs with respect to GENCODE gene annotations. Promoter DHSs are defined as the first DHS localizing within 1 kb upstream of a GENCODE TSS. Right: distribution of intergenic DHSs relative to Gencode TSSs. c, Distributions of the number of cell types, from 1 to 125 (y axis), in which DHSs in each of four classes (x axis) are observed. Width of each shape at a given y value shows the relative frequency of DHSs present in that number of cell types.
:75-82, September 6, DOI: /nature11232 Figure 1 | General features of the DHS landscape. a, Density of DNase I cleavage sites for selected cell types, shown for an example ~350-kb region. Two regions are shown to the right in greater detail. b, Left: distribution of 2,890,742 DHSs with respect to GENCODE gene annotations. Promoter DHSs are defined as the first DHS localizing within 1 kb upstream of a GENCODE TSS. Right: distribution of intergenic DHSs relative to Gencode TSSs. c, Distributions of the number of cell types, from 1 to 125 (y axis), in which DHSs in each of four classes (x axis) are observed. Width of each shape at a given y value shows the relative frequency of DHSs present in that number of cell types..")
29
© 2012 Nature Publishing Group. Published by Nature Publishing Group.5 Figure 3 The accessible chromatin landscape of the human genome. Figure 3 | Identification and directional classification of novel promoters. a, DNase I (blue) and H3K4me3 (red) tag densities for K562 cells around annotated TSS of ACTR3B. b, Averaged H3K4me3 tag density (red, right y axis) and log DNase I tag density (blue, left y axis) across 10,000 randomly selected GENCODE TSSs, oriented 5'->3'. Each blue and red curve is for a different cell type, showing invariance of the pattern. c, Relation of 113,615 promoter predictions to GENCODE annotations, with supporting EST and CAGE evidence (bar at right). d-f, Examples of novel promoters identified in K562; red arrow marks predicted TSS and direction of transcription, with CAGE tag clusters, spliced ESTs and GENCODE annotations above. d, Novel TSS confirmed by CAGE and ESTs. e, Novel TSS confirmed by CAGE, no ESTs. Note intronic location. f, Antisense prediction within annotated gene.
 and H3K4me3 (red) tag densities for K562 cells around annotated TSS of ACTR3B. b, Averaged H3K4me3 tag density (red, right y axis) and log DNase I tag density (blue, left y axis) across 10,000 randomly selected GENCODE TSSs, oriented 5 ->3 . Each blue and red curve is for a different cell type, showing invariance of the pattern. c, Relation of 113,615 promoter predictions to GENCODE annotations, with supporting EST and CAGE evidence (bar at right). d-f, Examples of novel promoters identified in K562; red arrow marks predicted TSS and direction of transcription, with CAGE tag clusters, spliced ESTs and GENCODE annotations above. d, Novel TSS confirmed by CAGE and ESTs. e, Novel TSS confirmed by CAGE, no ESTs. Note intronic location. f, Antisense prediction within annotated gene..")
30
© 2012 Nature Publishing Group. Published by Nature Publishing Group.8 Figure 4 Figure 4 | Co-association between transcription factors.a, Significant co-associations of transcription factor pairs using the GSC statistic across the entire genome in K562 cells. The colour strength represents the extent of association (from red (strongest), orange, to yellow (weakest)), whereas the depth of colour represents the fit to the GSC 20 model (where white indicates that the statistical model is not appropriate) as indicated by the key. Most transcription factors have a nonrandom association to other transcription factors, and these associations are dependent on the genomic context, meaning that once the genome is separated into promoter proximal and distal regions, the overall levels of co-association decrease, but more specific relationships are uncovered. b, Three classes of behaviour are shown. The first column shows a set of associations for which strength is independent of location in promoter and distal regions, whereas the second column shows a set of transcription factors that have stronger associations in promoter-proximal regions. Both of these examples are from data in K562 cells and are highlighted on the genome-wide co-association matrix (a) by the labelled boxes A and B, respectively. The third column shows a set of transcription factors that show stronger association in distal regions (in the H1 hESC line). An interactive version of this figure is available in the online version of the paper.
, orange, to yellow (weakest)), whereas the depth of colour represents the fit to the GSC 20 model (where white indicates that the statistical model is not appropriate) as indicated by the key. Most transcription factors have a nonrandom association to other transcription factors, and these associations are dependent on the genomic context, meaning that once the genome is separated into promoter proximal and distal regions, the overall levels of co-association decrease, but more specific relationships are uncovered. b, Three classes of behaviour are shown. The first column shows a set of associations for which strength is independent of location in promoter and distal regions, whereas the second column shows a set of transcription factors that have stronger associations in promoter-proximal regions. Both of these examples are from data in K562 cells and are highlighted on the genome-wide co-association matrix (a) by the labelled boxes A and B, respectively. The third column shows a set of transcription factors that show stronger association in distal regions (in the H1 hESC line). An interactive version of this figure is available in the online version of the paper..")
31
Reset?

33
Carroll From DNA...

34
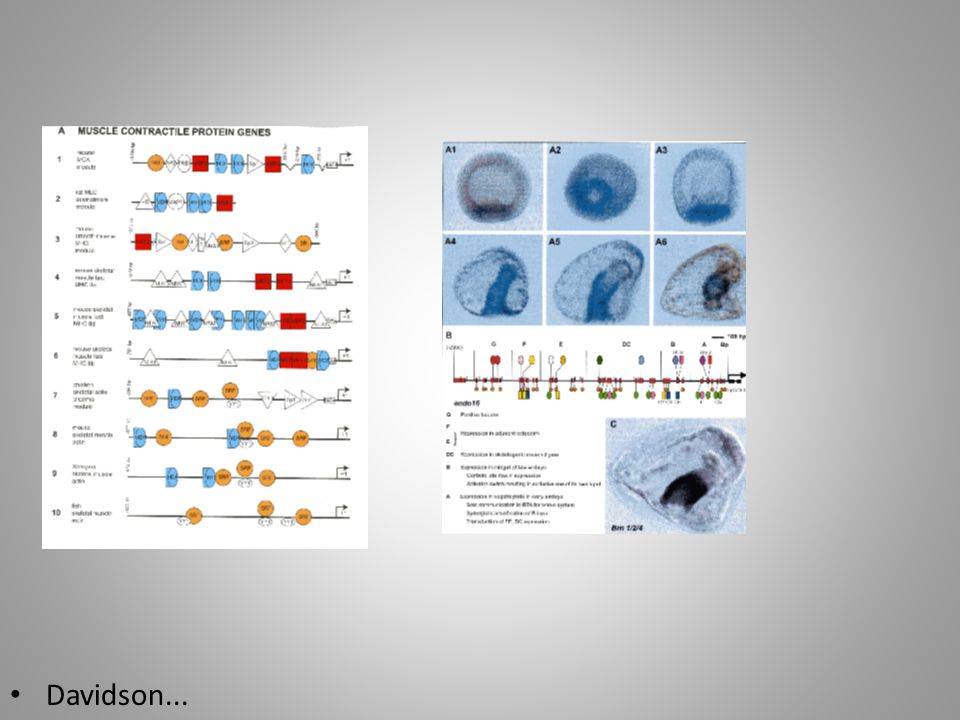
Davidson...

36
Carroll From DNA...

37
Operátor K prohledávání formálních řetězců a k operacím s nimi postačuje vyrobené zařízení, stroj; operace probíhají mechanicky, „bezmyšlenkovitě“. Formální jazyk je médium, ve kterém probíhá překódování mezi virtuálními řetězci znaků; sám program (pravidla) pro tyto operace však byl vytvořen entitami, které vládnou jazykem přirozeným. Řečové projevy (promluvy nebo psané texty) vyžadují přítomnost mluvčích, kteří nejsou stroji; také k porozumění takových projevů jsou nutní živí interpreti, kteří nejsou stroji. Řečová komunikace však probíhá formou výpovědí, které – na rozdíl od řeči samé – mohou být promítnuty do kvázi-digitálního řetězce jednotek (morfémů); lze také odvodit gramatická pravidla pro operace s řetězci morfémů.
 pro tyto operace však byl vytvořen entitami, které vládnou jazykem přirozeným. Řečové projevy (promluvy nebo psané texty) vyžadují přítomnost mluvčích, kteří nejsou stroji; také k porozumění takových projevů jsou nutní živí interpreti, kteří nejsou stroji. Řečová komunikace však probíhá formou výpovědí, které – na rozdíl od řeči samé – mohou být promítnuty do kvázi-digitálního řetězce jednotek (morfémů); lze také odvodit gramatická pravidla pro operace s řetězci morfémů..")
38
text vždy překračuje svého autora Nenajdeme čtenáře, který jednoduše čte to, co stojí v textu před jeho očima. Každé čtení znamená především naladění, takže čtenář je v jistém smyslu sám součástí vnímaného významu. Sám patří k textu, kterému rozumí. A linie smyslu, která se mu čtením vyjevuje, bude vždy nutně náhle končit v rozevřené neurčitosti. Může, ba musí si připustit, že budoucí pokolení budou tomu, co vyčetl z textu on, rozumět jinak.

39
Teze: (i) Existuje historická kontinuita „mluvčích“ udržovaná přes bezpočet generací rozmnožováním jedinců, ať už jsou jimi buňky, komunity buněk, anebo příslušníci populace či druhu, ekosystému nebo kultury; ke kontinuitě komunity nutně patří i smrt jedinců. (ii) schopnost rozčlenit signály a zprávy do lineárních kvázidigitálních řetězců, a s tím spojená znalost gramatických pravidel, jak s nimi zacházet a transformovat je dál; s tím souvisí schopnost zápisu „poznámek“, „podtrhávání“ apod., a jejich následné čtení; (iii) Čtení i zapisování vyžaduje mluvčí, a jejich existenci lze prokázat; doklady z evodevo dokonce dovolují předpokládat existenci druhově specifické řeči.
 schopnost rozčlenit signály a zprávy do lineárních kvázidigitálních řetězců, a s tím spojená znalost gramatických pravidel, jak s nimi zacházet a transformovat je dál; s tím souvisí schopnost zápisu „poznámek , „podtrhávání apod., a jejich následné čtení; (iii) Čtení i zapisování vyžaduje mluvčí, a jejich existenci lze prokázat; doklady z evodevo dokonce dovolují předpokládat existenci druhově specifické řeči..")
Podobné prezentace